5 December, 2018
Thanks for visiting the site.
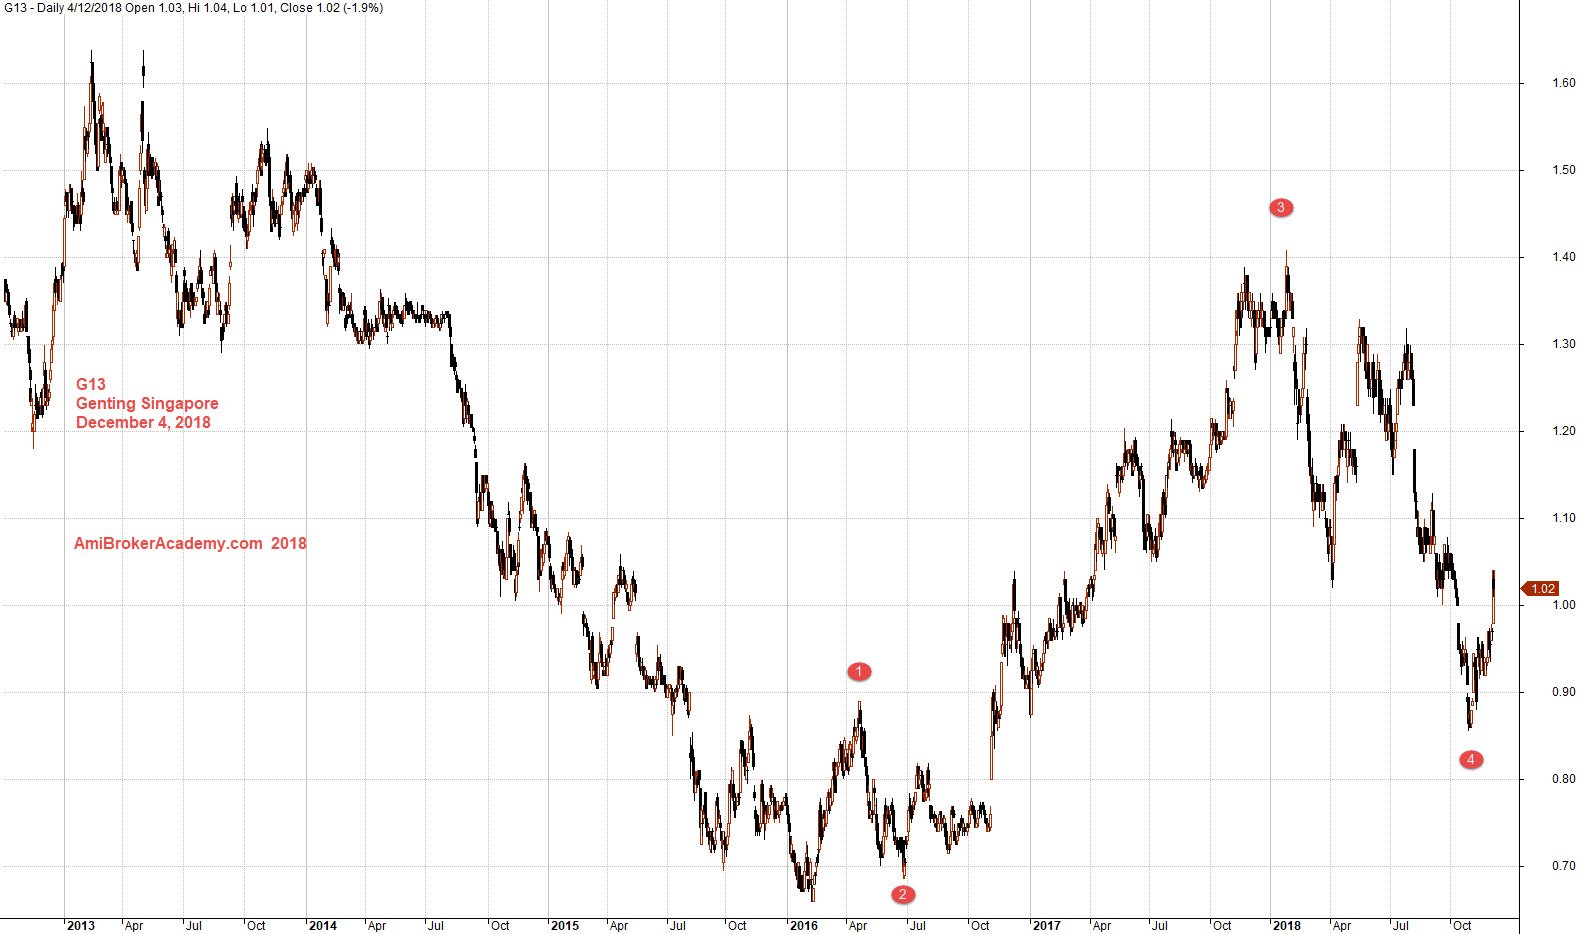
G13 Genting Singapore Charting
Study Genting Singapore chart, price after pullback from the peak above 1.6 dollars in 2013, the price just can not go any high or higher. The price tested below 70 cents in 2016, not just once, but twice before starts to climb again. The price at best only reach 1.40 dollars. Use the wave count, this might be the third wave. The price begin to pullback again.
Trade with your eyes open.
December 4, 2018 Genting Singapore and Wave Count
if you can see the full chart, “press Ctrl and -” to zoom out and see the entire chart.
Zoom in study the stock price using MACD, we see the price action goes sideways and resisted at 1.40 dollars. The price action after try to breakout 1.40 dollars and fail. The price action begin to move south.
Trade with your eyes open.
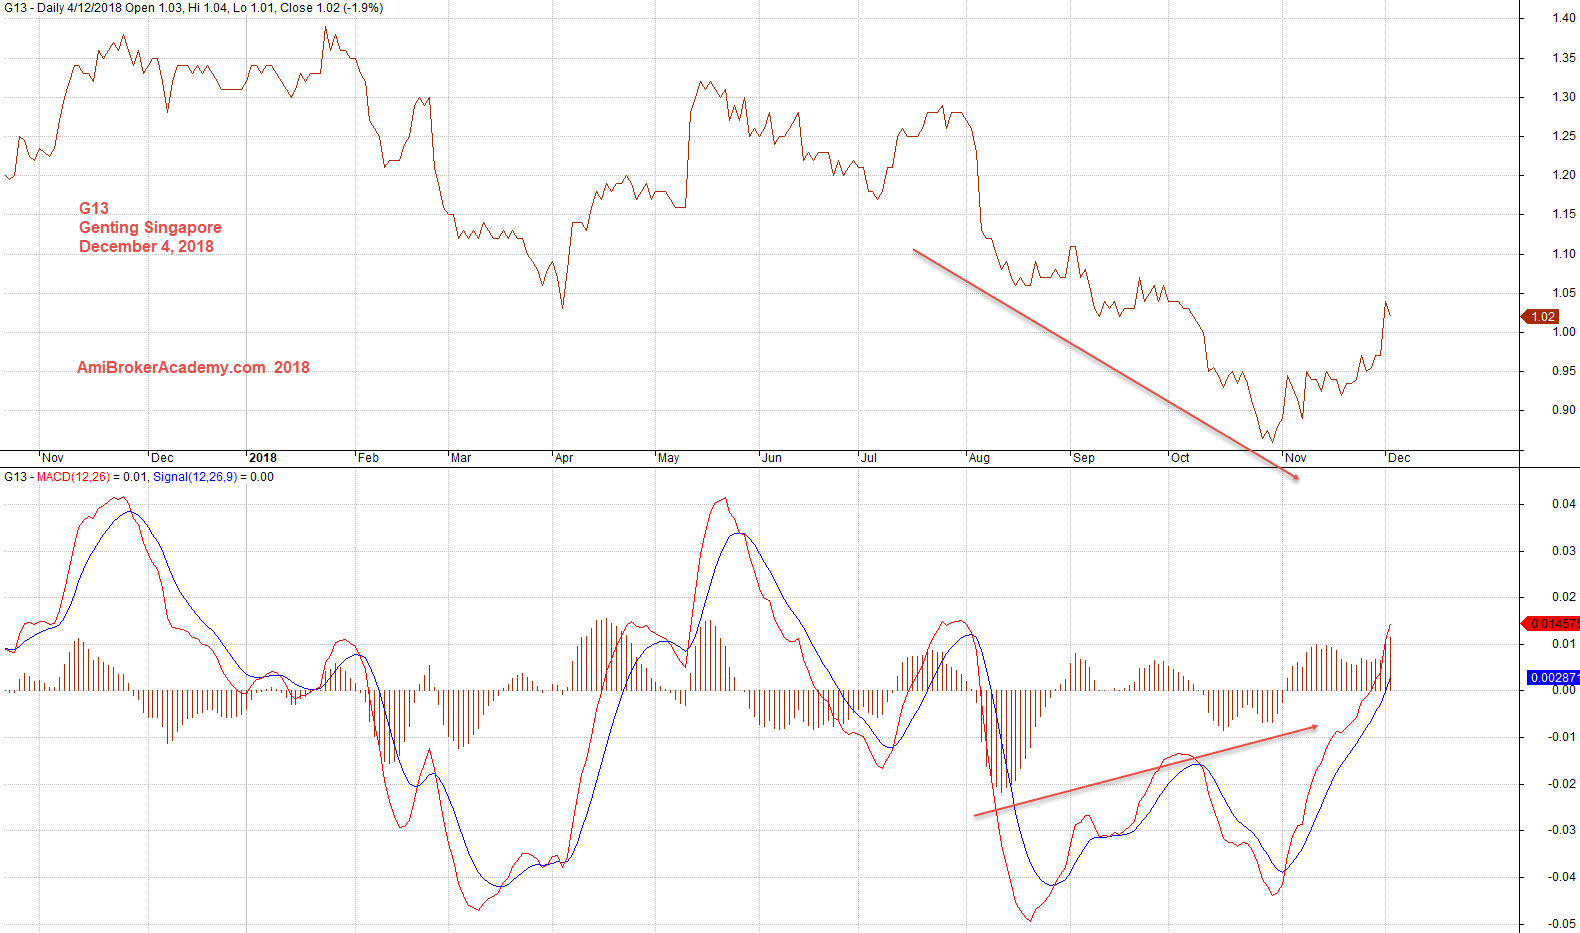
December 4, 2018 Genting Singapore Line Chart and MACD
Moses US Stock Chart Analysis
AmiBrokerAcademy.com
Disclaimer
The above result is for illustration purpose. It is not meant to be used for buy or sell decision. We do not recommend any particular stocks. If particular stocks of such are mentioned, they are meant as demonstration of Amibroker as a powerful charting software and MACD. Amibroker can program to scan the stocks for buy and sell signals.
These are script generated signals. Not all scan results are shown here. The MACD signal should use with price action. Users must understand what MACD and price action are all about before using them. If necessary you should attend a course to learn more on Technical Analysis (TA) and Moving Average Convergence Divergence, MACD.
Once again, the website does not guarantee any results or investment return based on the information and instruction you have read here. It should be used as learning aids only and if you decide to trade real money, all trading decision should be your own.