9 August, 2019
Welcome to AmiBrokerAcademy.com. Thanks for visiting the site.
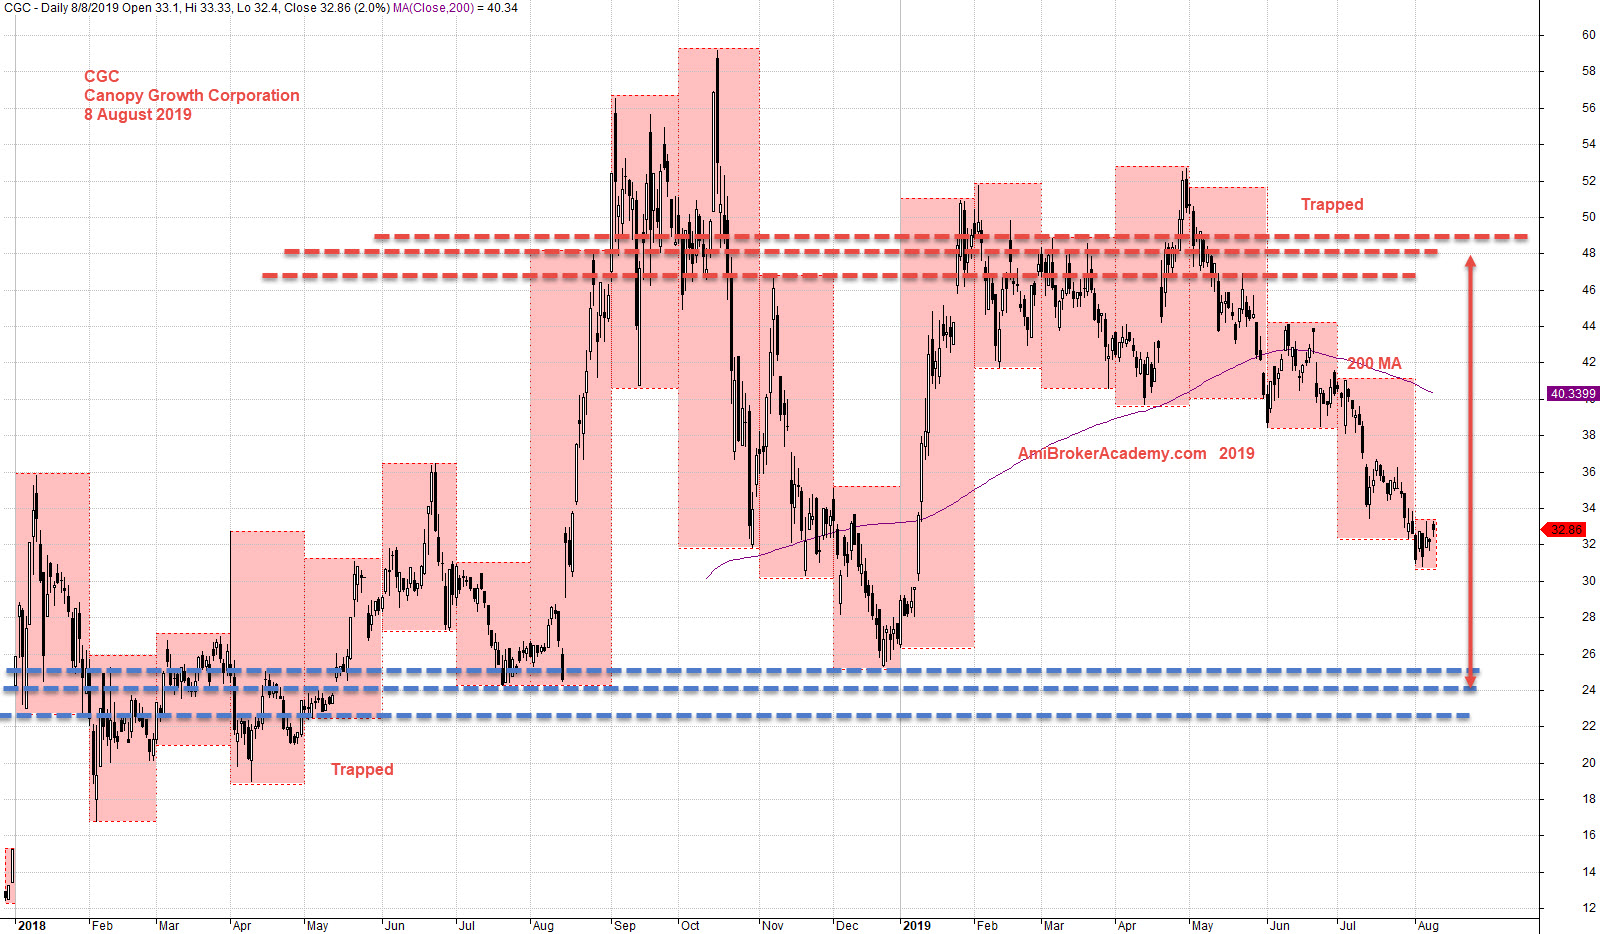
CGC Canopy Growth Corporation Stock Charting
Study Canopy Growth Corporation Stock and key levels.
One of the stock to be tracked by Bloomberg Intelligence. True or true? Be careful what you want!
See chart, picture worth a thousand words.
Support Resistance is the most fundamental in technical analysis, but to know how to draw a trune support resistance is not as what you think that easy.
One way to overcome this confusion, is to use boxes. You could use day, week, or month boxes to find the common level for support or resistance. These common level will have an important role later.
Of course you could use the year month high or low too.
See Canopy Growth Corporation stock key levels. Price action is trapped between two key levels.
Trade with your eyes open.
Moses Stock Observation
AmiBrokerAcademy.com
Disclaimer
The above result is for illustration purpose. It is not meant to be used for buy or sell decision. We do not recommend any particular stocks. If particular stocks of such are mentioned, they are meant as demonstration of Amibroker as a powerful charting software and MACD. Amibroker can program to scan the stocks for buy and sell signals.
These are script generated signals. Not all scan results are shown here. The MACD signal should use with price action. Users must understand what MACD and price action are all about before using them. If necessary you should attend a course to learn more on Technical Analysis (TA) and Moving Average Convergence Divergence, MACD.
Once again, the website does not guarantee any results or investment return based on the information and instruction you have read here. It should be used as learning aids only and if you decide to trade real money, all trading decision should be your own.