20 January 2019
Welcome to AmiBrokerAcademy.com. We provide US stock analysis for academy learning.
Think!
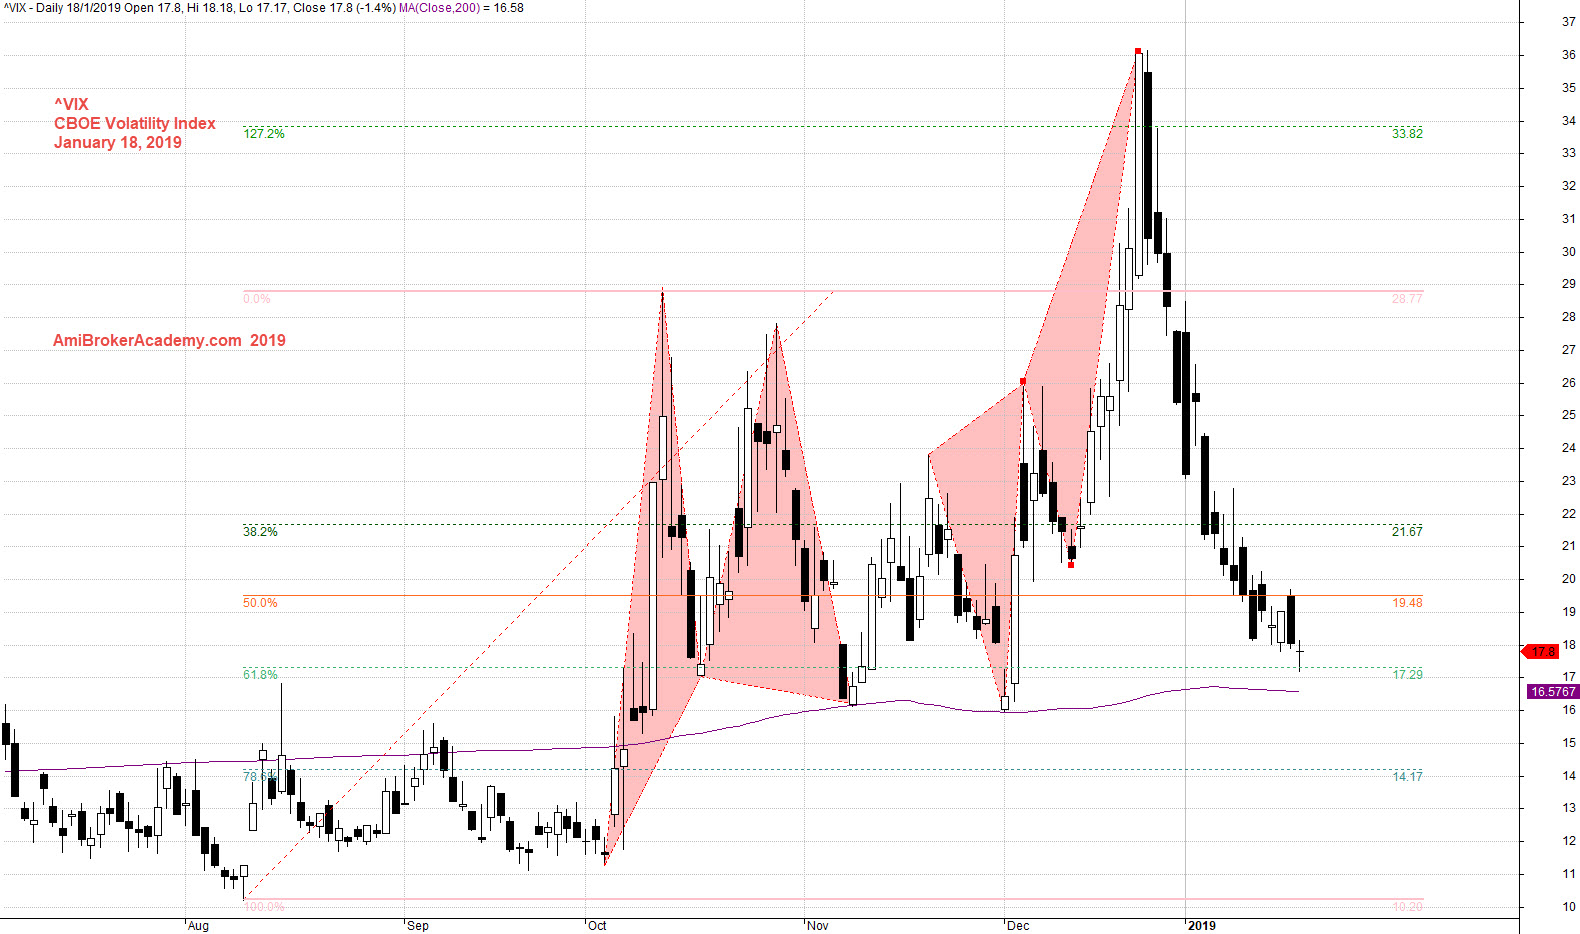
^VIX Volatility Index Stock Charting
Study CBOE Volatility Index chart using Fibonacci Extension. Swing low to high, price action test the 127% and higher. Price action trapped.
Trade with eyes open.
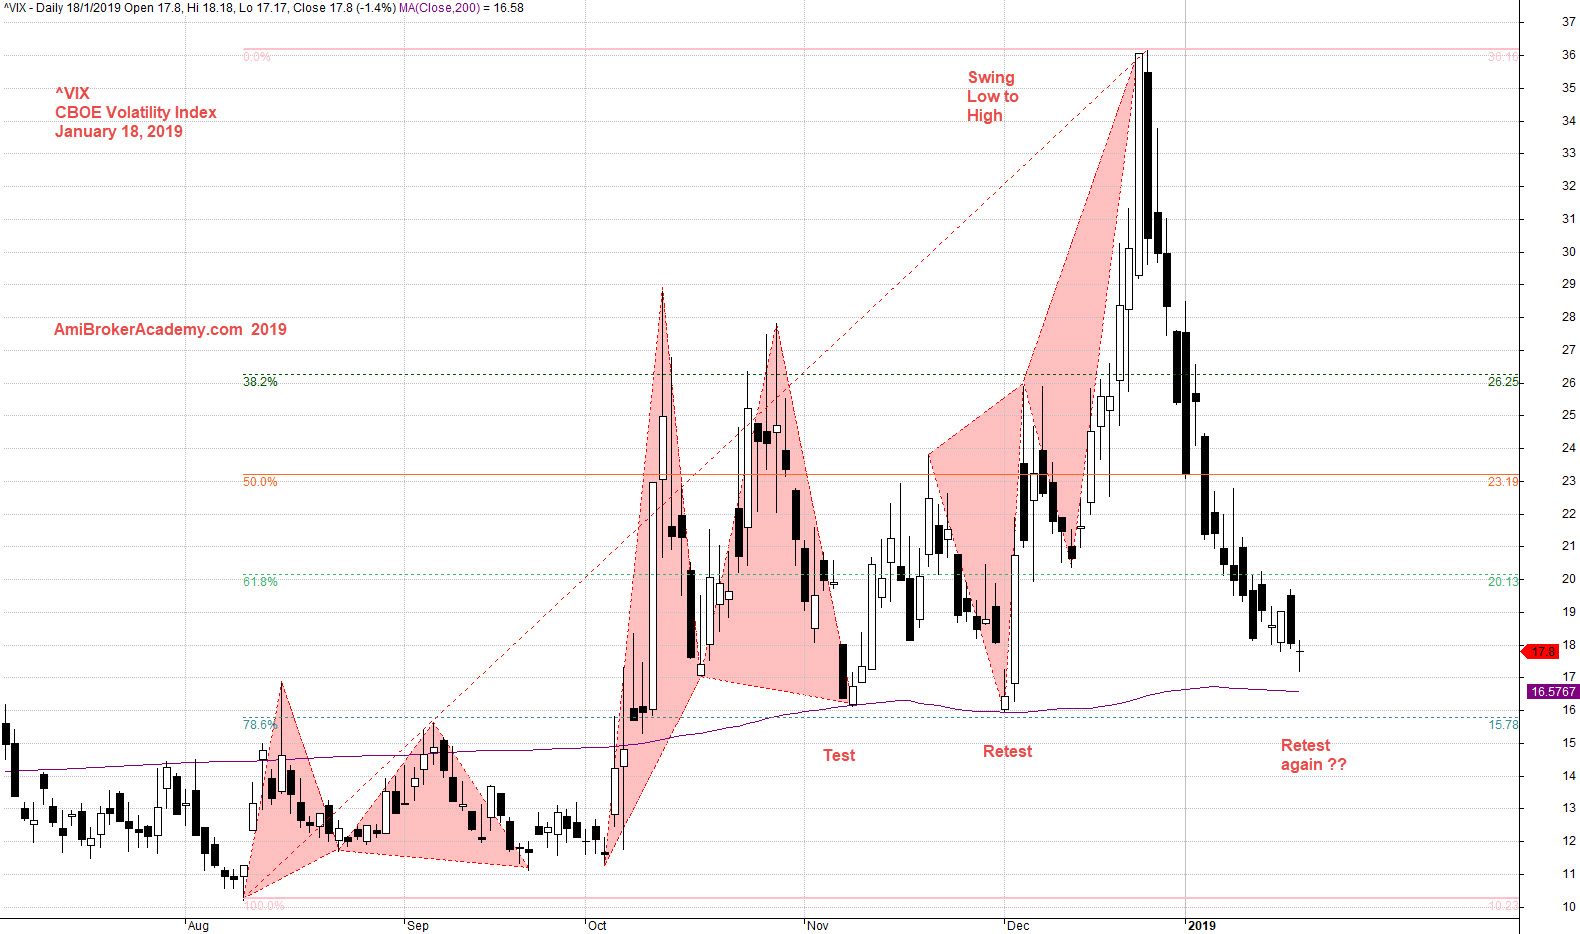
Swing low to high see the price action fibonacci retracement, the price action has been test and retest 78%. Now the price action pullback again to retest the same level, will see.
Moses Stock Analysis
AmiBrokerAcademy.com
Disclaimer
The above result is for illustration purpose. It is not meant to be used for buy or sell decision. We do not recommend any particular stocks. If particular stocks of such are mentioned, they are meant as demonstration of Amibroker as a powerful charting software and MACD. Amibroker can program to scan the stocks for buy and sell signals.
These are script generated signals. Not all scan results are shown here. The MACD signal should use with price action. Users must understand what MACD and price action are all about before using them. If necessary you should attend a course to learn more on Technical Analysis (TA) and Moving Average Convergence Divergence, MACD.
Once again, the website does not guarantee any results or investment return based on the information and instruction you have read here. It should be used as learning aids only and if you decide to trade real money, all trading decision should be your own.