29 April, 2018
Singapore Stock Analysis
Venture Corporation and Fibonacci Retracement Low to High
Study Venture Corporation stock price using Fibonacci Retracemnet, swing low to high. We see a bearish week last week. The stock price decline to test 61%. Trade with your eyes open.
Manage your risk.
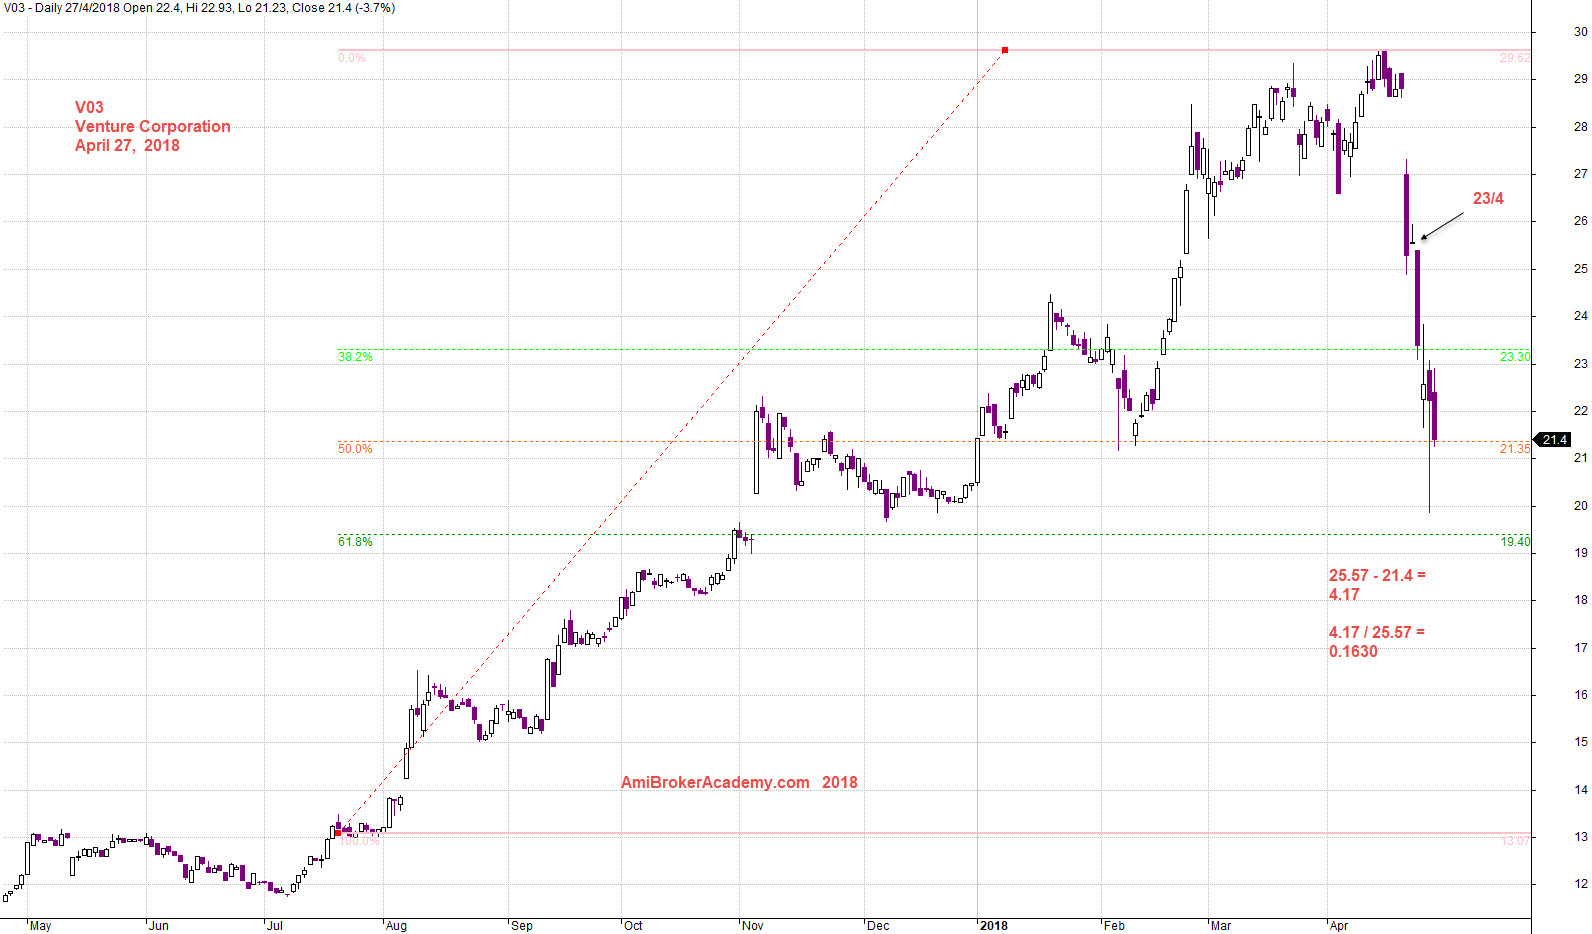
20180427 Venture Corporation and Fibo Retracement Low to High
In One Week AEM Holdings Stock Price Close 4.17 Lower
See chart, on MACD indicator.
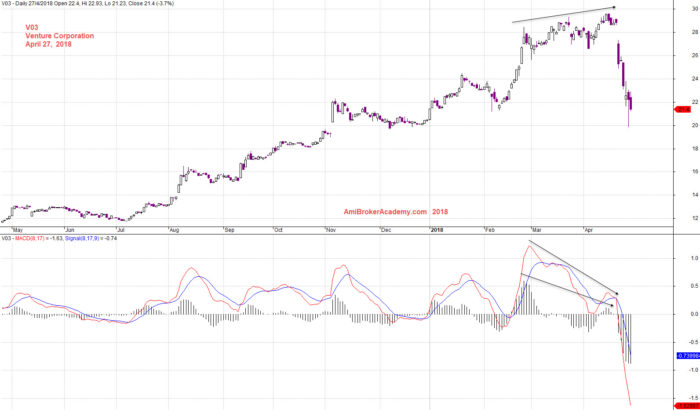
20180427 Venture Corporation and MACD
Moses Singapore Stock Analysis
AmiBrokerAcademy.com
Disclaimer
The above result is for illustration purpose. It is not meant to be used for buy or sell decision. We do not recommend any particular stocks. If particular stocks of such are mentioned, they are meant as demonstration of Amibroker as a powerful charting software and MACD. Amibroker can program to scan the stocks for buy and sell signals.
These are script generated signals. Not all scan results are shown here. The MACD signal should use with price action. Users must understand what MACD and price action are all about before using them. If necessary you should attend a course to learn more on Technical Analysis (TA) and Moving Average Convergence Divergence, MACD.
Once again, the website does not guarantee any results or investment return based on the information and instruction you have read here. It should be used as learning aids only and if you decide to trade real money, all trading decision should be your own.