10 October, 2018
Welcome to AmiBrokerAcademy.com.
Thanks for visiting the site.
Elon Musk
Tesla CEO Elon Musk is thinking about taking the company private, he said in a Tweet on August 8, 2018 moring. See below.

Elon Musk Tweet (Source from Internet)
SAN FRANCISCO, Tesla confirmed on Tuesday (Sept 18) that US Justice Department officials were looking into possible criminal aspects of a seemingly spontaneous, and later aborted, announcement by chief executive Elon Musk on taking the electric automaker private.
Shares skidded as word spread of a criminal investigation triggered by Musk’s Twitter comments. Tesla shares ended the formal Nasdaq trading day down 3.35% to 284.96 dollars.
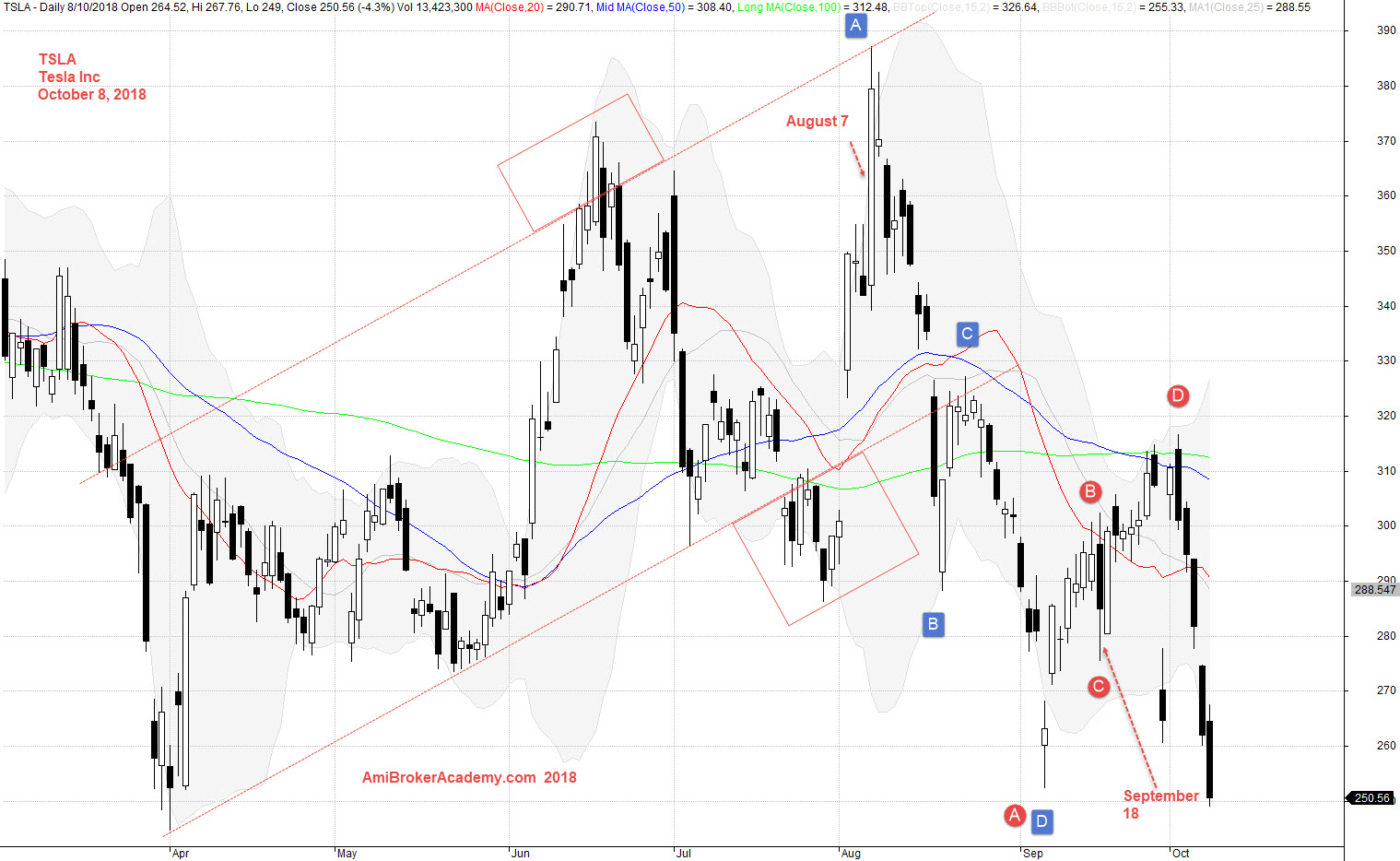
TSLA Tesla Inc Daily Charting
Buy Support Sell Resistance
Buy Low Sell High
Sometime you need news to help the stock price to move. But how to buy low sell high? To buy low, in a bull trend and ABCD pattern. Look out for point A and C, try to enter the buy at Point A and C. It is likely point A and C are at the support. The reverse is true too, in a bear trend and ABCD pattern. Look for point A and C, try the taking profit at point A and C, It is likely that point A and C is near the resistance. This is a suggestion only, as this is likely to maximize your profit.
Study chart of Tesla Inc Daily stock price, picture worth a thousand words. We see stock price moves from low to high. The stock price was below 250 dollars in April. Stock price moves in H M Gartley ABCD pattern up, see chart. You may see multiple of ABCD pattern. The price action tested near 390. If you look back the stock price keeps come back to test the 390 dollars level. Now the stock price is at 250 dollars.
Trade with eyes open.
Manage your risk.
October 8, 2018 Tesla Inc and ABCD
if you can see the full chart, “press Ctrl and -” to zoom out and see the entire chart.
Moses US Stock Chart Analysis
AmiBrokerAcademy.com
Disclaimer
The above result is for illustration purpose. It is not meant to be used for buy or sell decision. We do not recommend any particular stocks. If particular stocks of such are mentioned, they are meant as demonstration of Amibroker as a powerful charting software and MACD. Amibroker can program to scan the stocks for buy and sell signals.
These are script generated signals. Not all scan results are shown here. The MACD signal should use with price action. Users must understand what MACD and price action are all about before using them. If necessary you should attend a course to learn more on Technical Analysis (TA) and Moving Average Convergence Divergence, MACD.
Once again, the website does not guarantee any results or investment return based on the information and instruction you have read here. It should be used as learning aids only and if you decide to trade real money, all trading decision should be your own.