30 August, 2018
Thanks for visiting the site.
Let’s Study the Market Cycles
Bull and Bear Trend Cycles.
This is an important chart to keep. You know why!
Moses Stock Stories – Thinking Out Loud
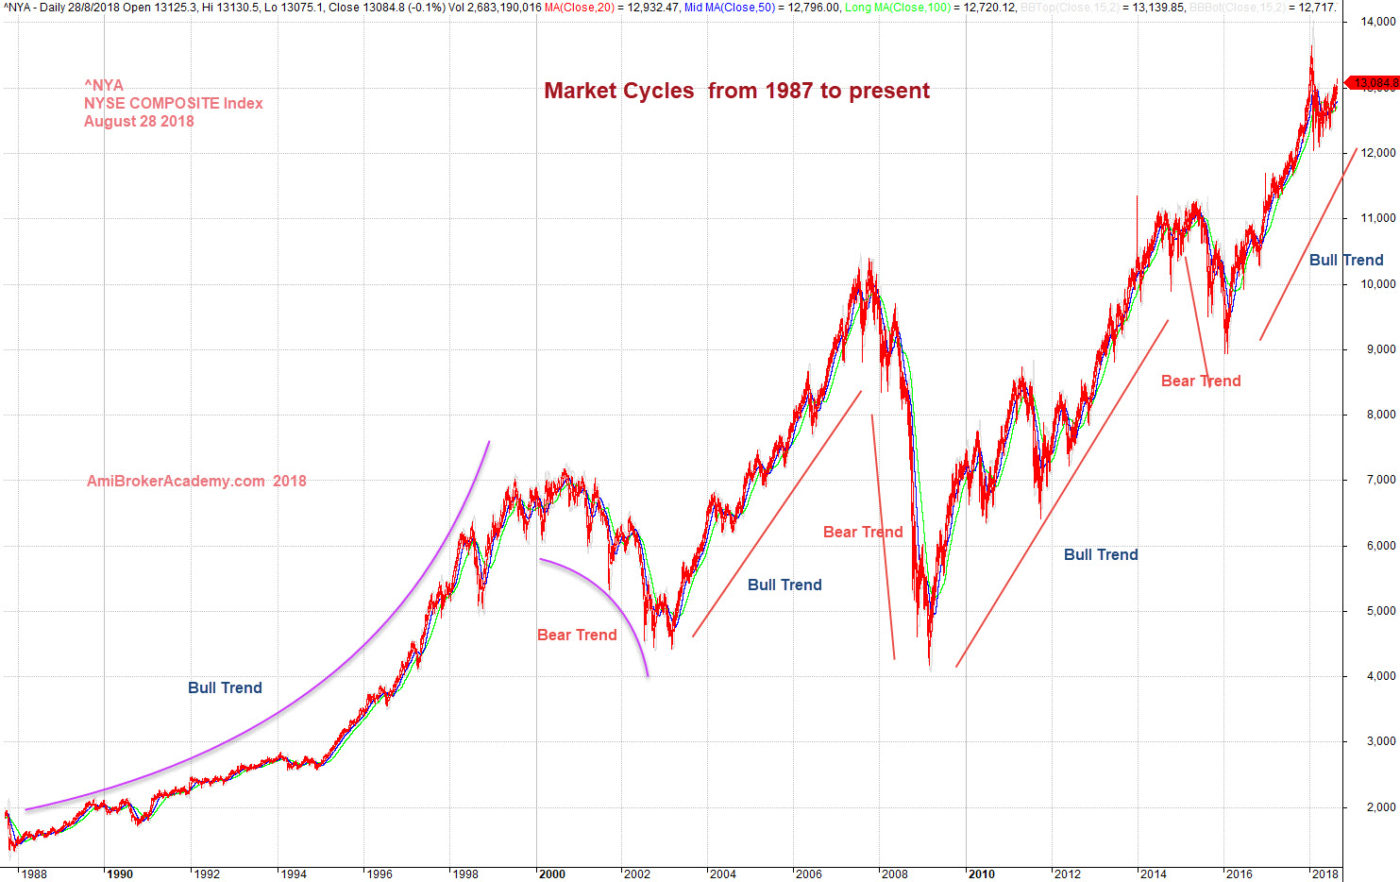
US Stock Market Cycles From 1987 – NYSE Composite Index
Study US stock market, look left and make your new trading plan. From chart, the highest level are near 14000, and it is only recently. See chart, picture worth a thousand words. In short the market is bullish since day one. But if you will look at the chart in details, you will find the bull and the bear trend. 1) From 1987 till 2000 the market keep going higher, bull cycle, 2) 2000 too 2002, due the the dot com the stock market crashed, the bear stepped in. 3) from 2003 till 2008, the stock market become bull again, as the price action continue to form higher high. 4) Lehman Brothers brought everyone down to their knee, the market crashed again, this is 2008 to 2009, bear trend. 5) After that the market recover, the 2009 to 2014 the market continue to form higher high, the price action try to retest the high of 2007, it made it and closed slightly higher. It is bull cycle. 6) It has a small pullback for 2015 to 2016, bear trend. 7) Next the market rebounce to go rocket high of today, bull again. So, 2016 to present. If you will looking at a bigger picture, you can also see from 2009 to present is the bull cycle. Trade with you eyes open, manage your risk.
In a bull cycle, all traders are geneious.
In stock trading there is no end to such kind of success or failure stories. The only thing is trade with eyes open. You are responsible for your won trading. Do not blame anyone.
Manage Your Risk!
US Stock Market Cycle – New York Stock Exchange Composite Index Market Cycles from 1987
This is a very important stock chart, save this chart for future reference.
Moses
AmiBrokerAcademy.com
Disclaimer
The above result is for illustration purpose. It is not meant to be used for buy or sell decision. We do not recommend any particular stocks. If particular stocks of such are mentioned, they are meant as demonstration of Amibroker as a powerful charting software and MACD. Amibroker can program to scan the stocks for buy and sell signals.
These are script generated signals. Not all scan results are shown here. The MACD signal should use with price action. Users must understand what MACD and price action are all about before using them. If necessary you should attend a course to learn more on Technical Analysis (TA) and Moving Average Convergence Divergence, MACD.
Once again, the website does not guarantee any results or investment return based on the information and instruction you have read here. It should be used as learning aids only and if you decide to trade real money, all trading decision should be your own.