3 October, 2018
Thanks for visiting the site.
KMI Kinder Morgan Daily Charting
Buy Support Sell Resistance
Buy Low Sell High
Study chart of Kinder Morgan Daily stock price, picture worth a thousand words. We see stock price goes lower in April below 15 dollars. The price action rebounce to the high of near 18.5 dollars. The price action tested many times at that region. MACD keeps going lower, forms lower high. See chart.
Trade with eyes open.
Manage your risk.
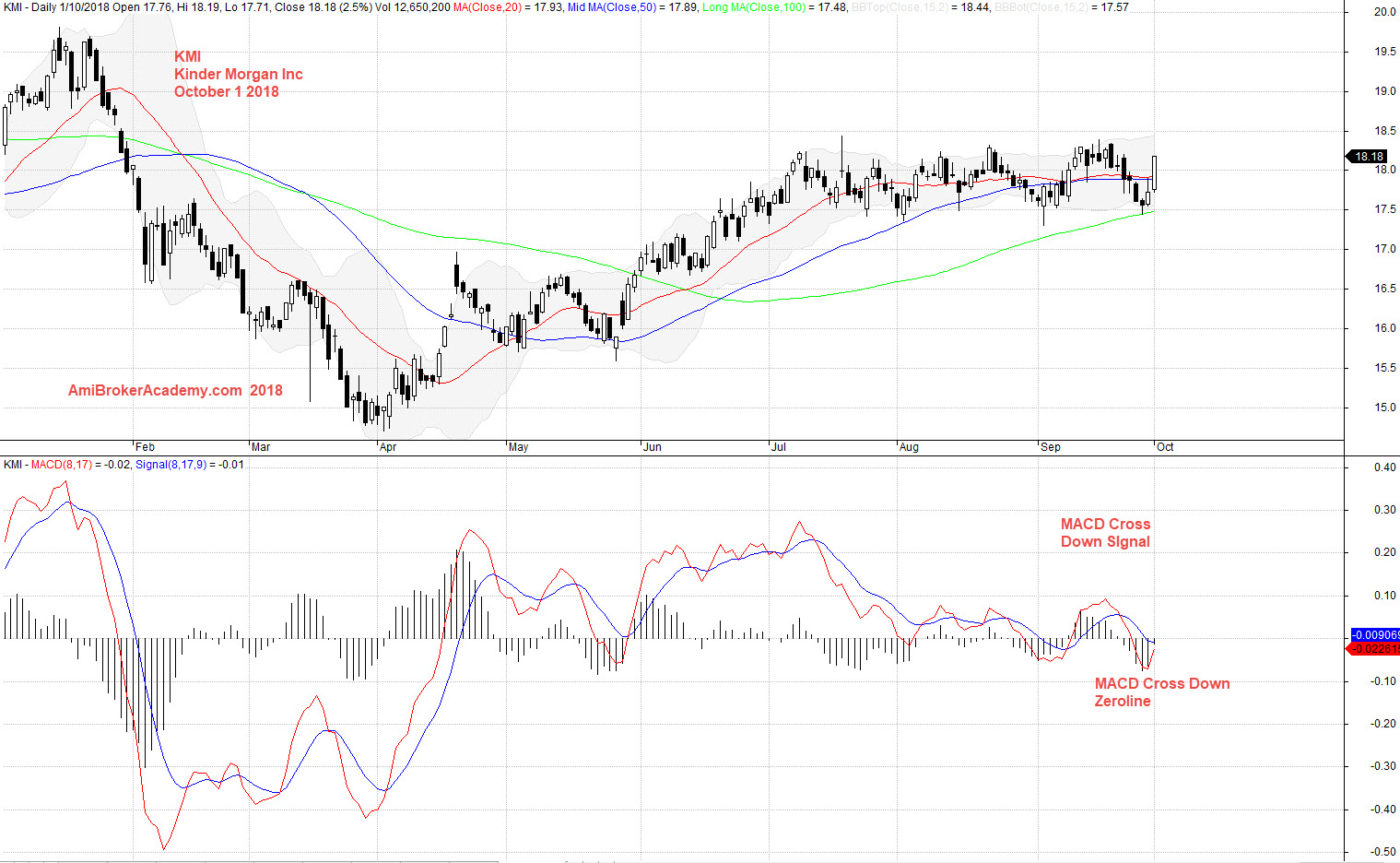
October 1, 2018 Kinder Morgan Daily Chart and MACD
if you can see the full chart, “press Ctrl and -” to zoom out and see the entire chart.
Imagine we study the weekly chart instead of the daily. What is the different? See chart, and compare both the weekly and daily chart. Picture worth a thousand words.
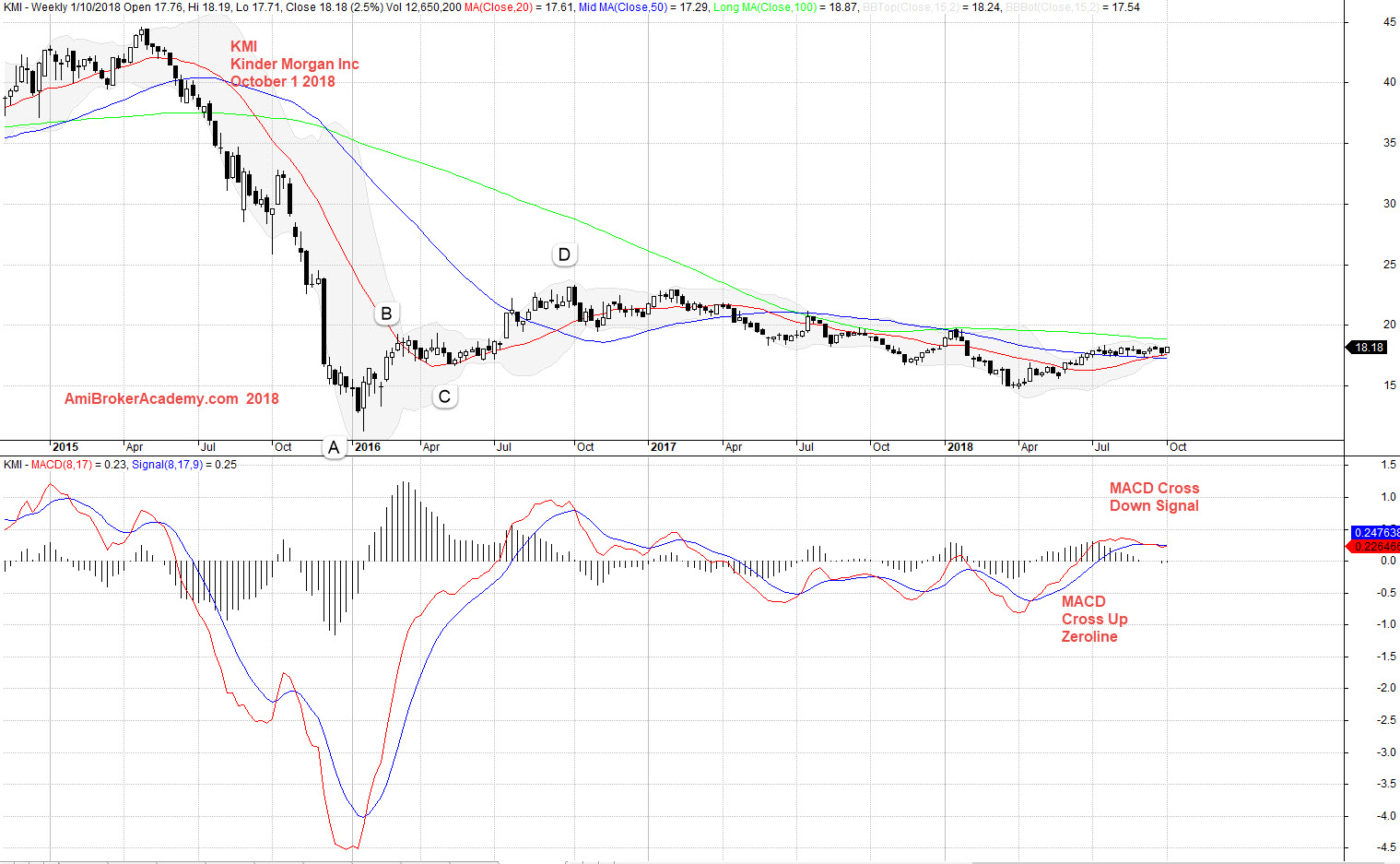
October 1, 2018 Kinder Morgan Weekly Chart and MACD
Moses US Stock Chart Analysis
AmiBrokerAcademy.com
Disclaimer
The above result is for illustration purpose. It is not meant to be used for buy or sell decision. We do not recommend any particular stocks. If particular stocks of such are mentioned, they are meant as demonstration of Amibroker as a powerful charting software and MACD. Amibroker can program to scan the stocks for buy and sell signals.
These are script generated signals. Not all scan results are shown here. The MACD signal should use with price action. Users must understand what MACD and price action are all about before using them. If necessary you should attend a course to learn more on Technical Analysis (TA) and Moving Average Convergence Divergence, MACD.
Once again, the website does not guarantee any results or investment return based on the information and instruction you have read here. It should be used as learning aids only and if you decide to trade real money, all trading decision should be your own.