31 October, 2018
Thanks for visiting the site.
PYPL PayPal Holdings Inc Daily Charting
Buy Support Sell Resistance
Buy Low Sell High
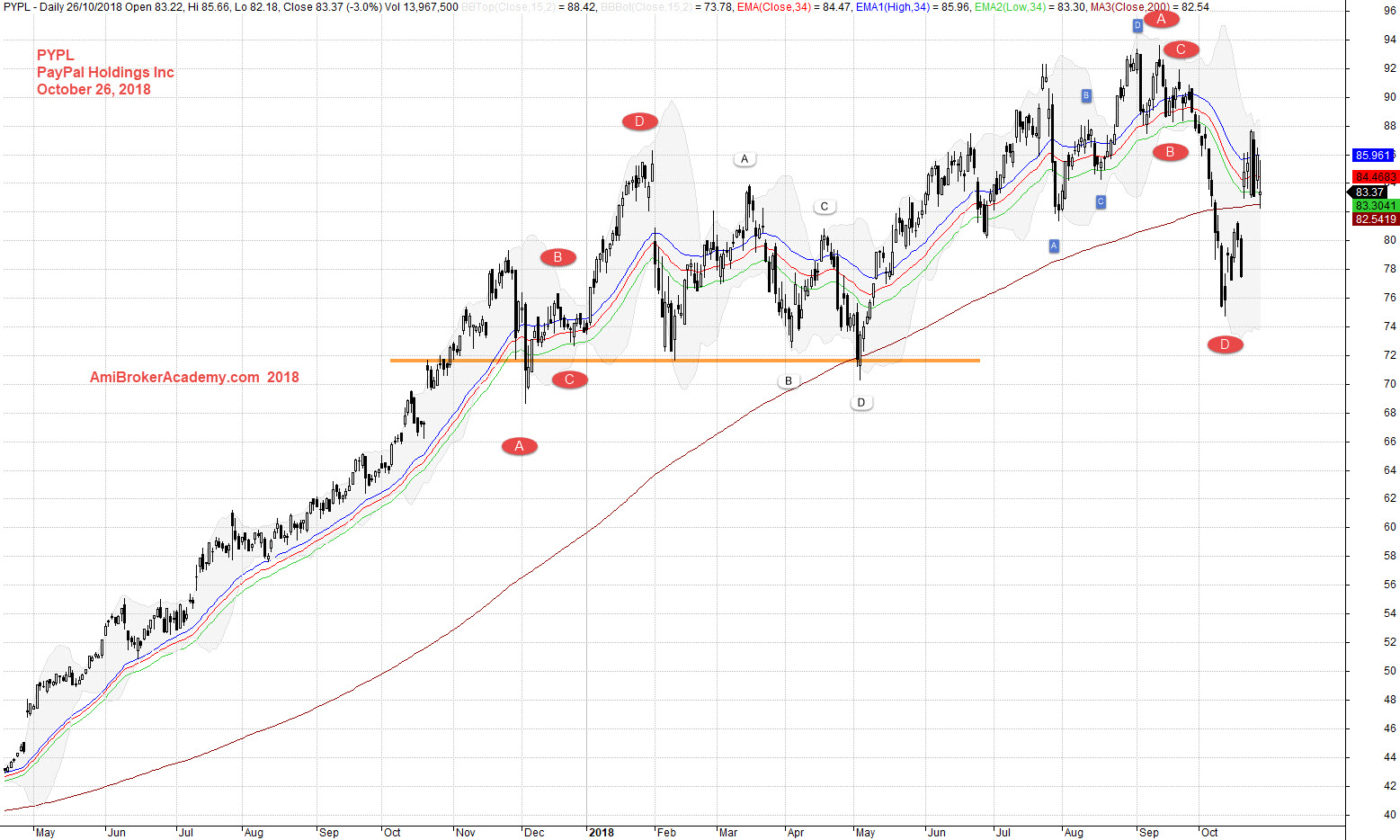
Study chart of PayPal Holdings Inc Daily stock chart.
See chart, the price action from the low near 42 dollars to the peak at 94 dollars. The key support was 72 dollars. You could find many H M Gartley 222 pattern.
Think think got more things.
Manage your risk.
October 26, 2018 PayPal Holdings Inc and River
if you can see the full chart, “press Ctrl and -” to zoom out and see the entire chart.
Add MACD indicator, see chart.
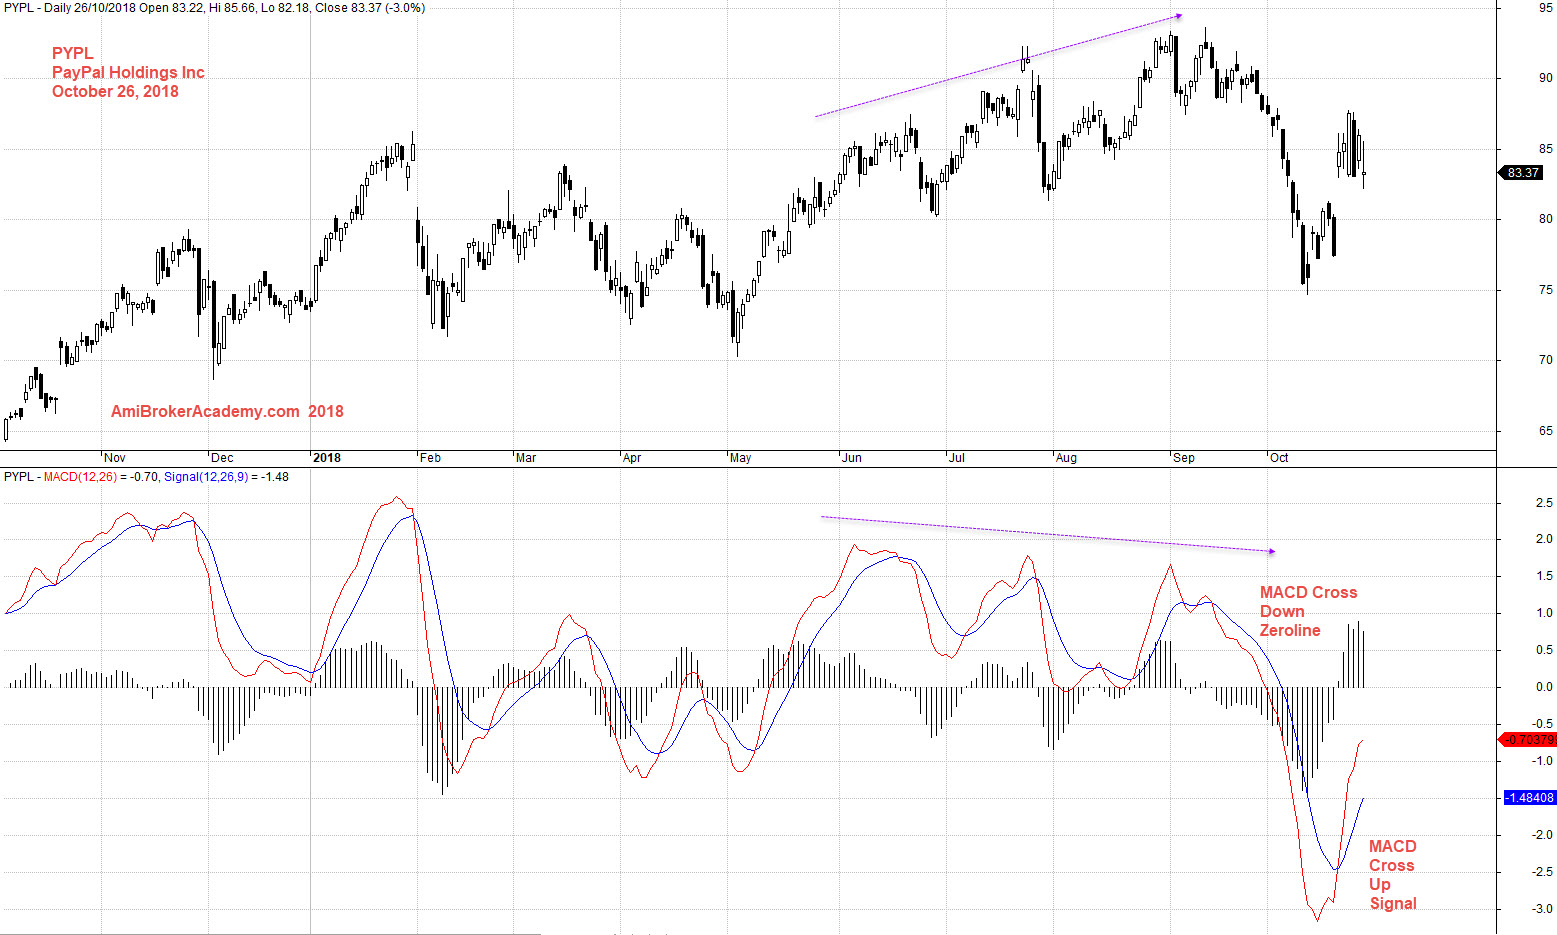
October 26, 2018 PayPal Holdings Inc and MACD
Moving Averages is a great visual tool to see the trend, with 20, 50, 100 and 200 period moving averages. See chart, picture worth a thousand words.
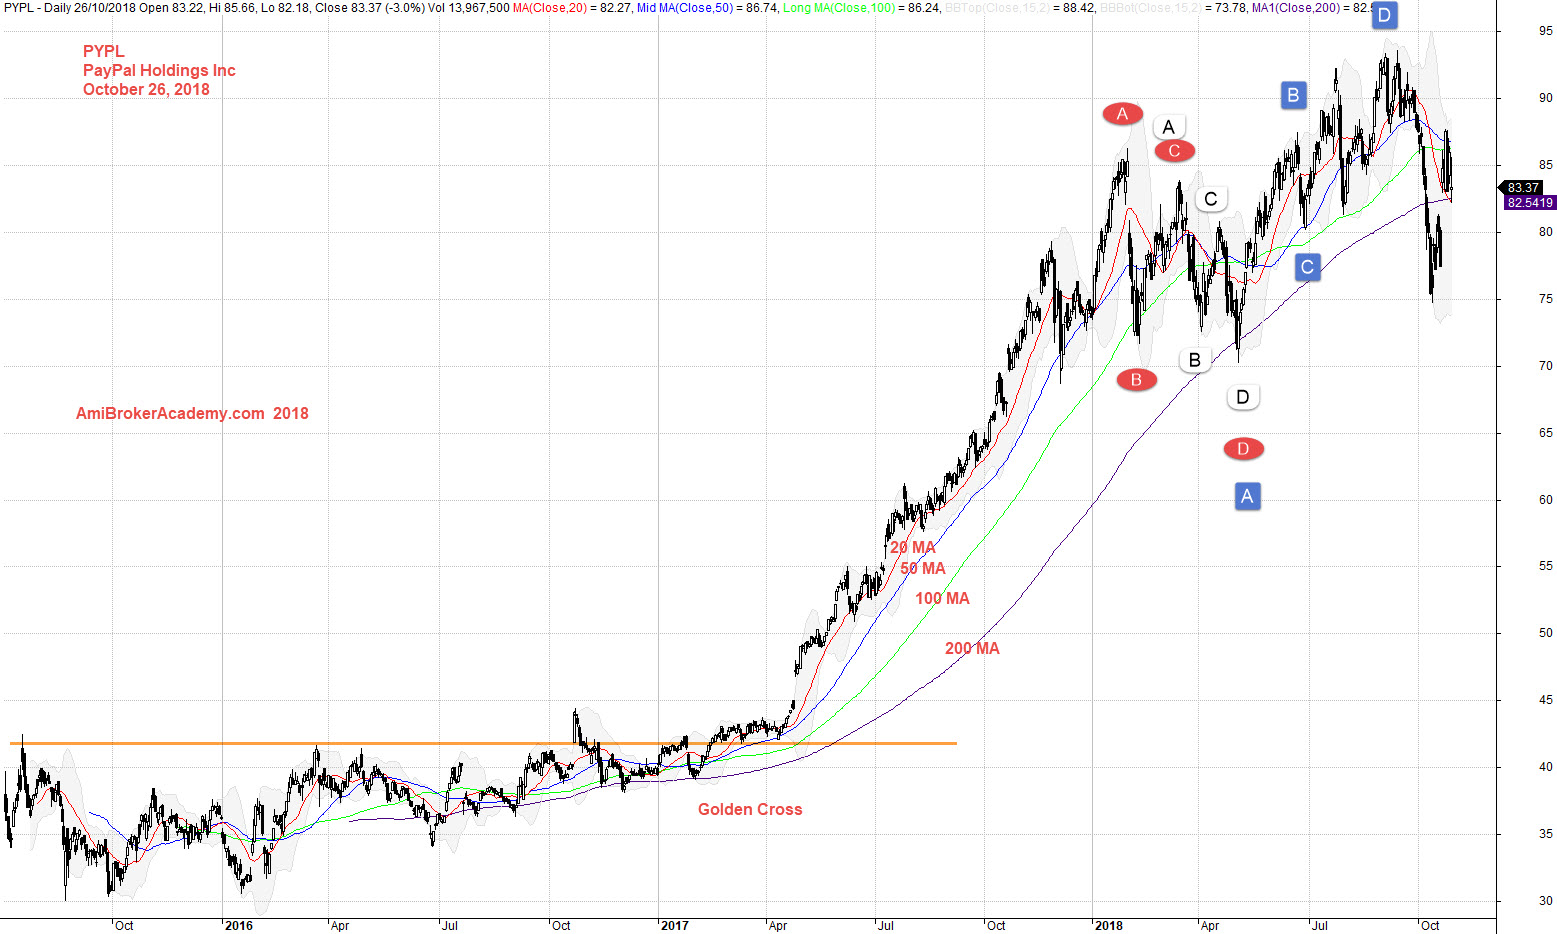
October 26, 2018 PayPal Holdings Inc and Moving Averages
Moses US Stock Chart Analysis
AmiBrokerAcademy.com
Disclaimer
The above result is for illustration purpose. It is not meant to be used for buy or sell decision. We do not recommend any particular stocks. If particular stocks of such are mentioned, they are meant as demonstration of Amibroker as a powerful charting software and MACD. Amibroker can program to scan the stocks for buy and sell signals.
These are script generated signals. Not all scan results are shown here. The MACD signal should use with price action. Users must understand what MACD and price action are all about before using them. If necessary you should attend a course to learn more on Technical Analysis (TA) and Moving Average Convergence Divergence, MACD.
Once again, the website does not guarantee any results or investment return based on the information and instruction you have read here. It should be used as learning aids only and if you decide to trade real money, all trading decision should be your own.