15 December, 2018
Think think got more things.
Thanks for visiting the site.
NTRI Nutri System Inc Daily Chart
We strongly suggest you Buy Low Sell High
Or its Equal to Buy Support Sell Resistance
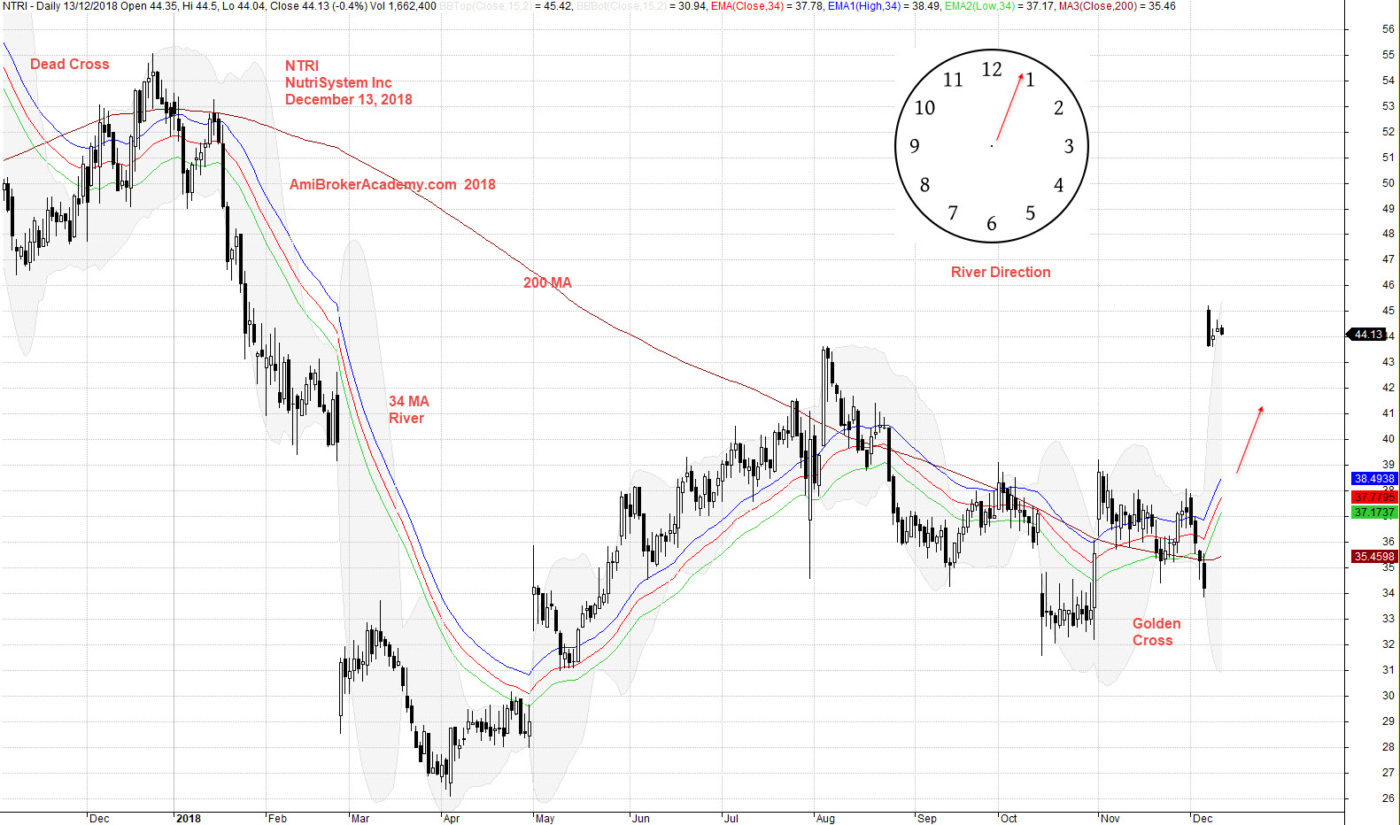
We see price action closed higher and higher just before 2018 and hit the peak at 55 dollars.
Thereafter, the price action begin to fail and drop down, move south fast. From a moving average perspective, there was a dead cross. The price action fail to close above River, 34 MA Band. The price action follow the MA and travel south.
Price action test the low at 26 dollars and begin to pullback. First the price action close above MA band, river. But the golden cross fail. The price action again goes below MA.
Trade with your eyes open.
if you can see the full chart, “press Ctrl and -” to zoom out and see the entire chart.
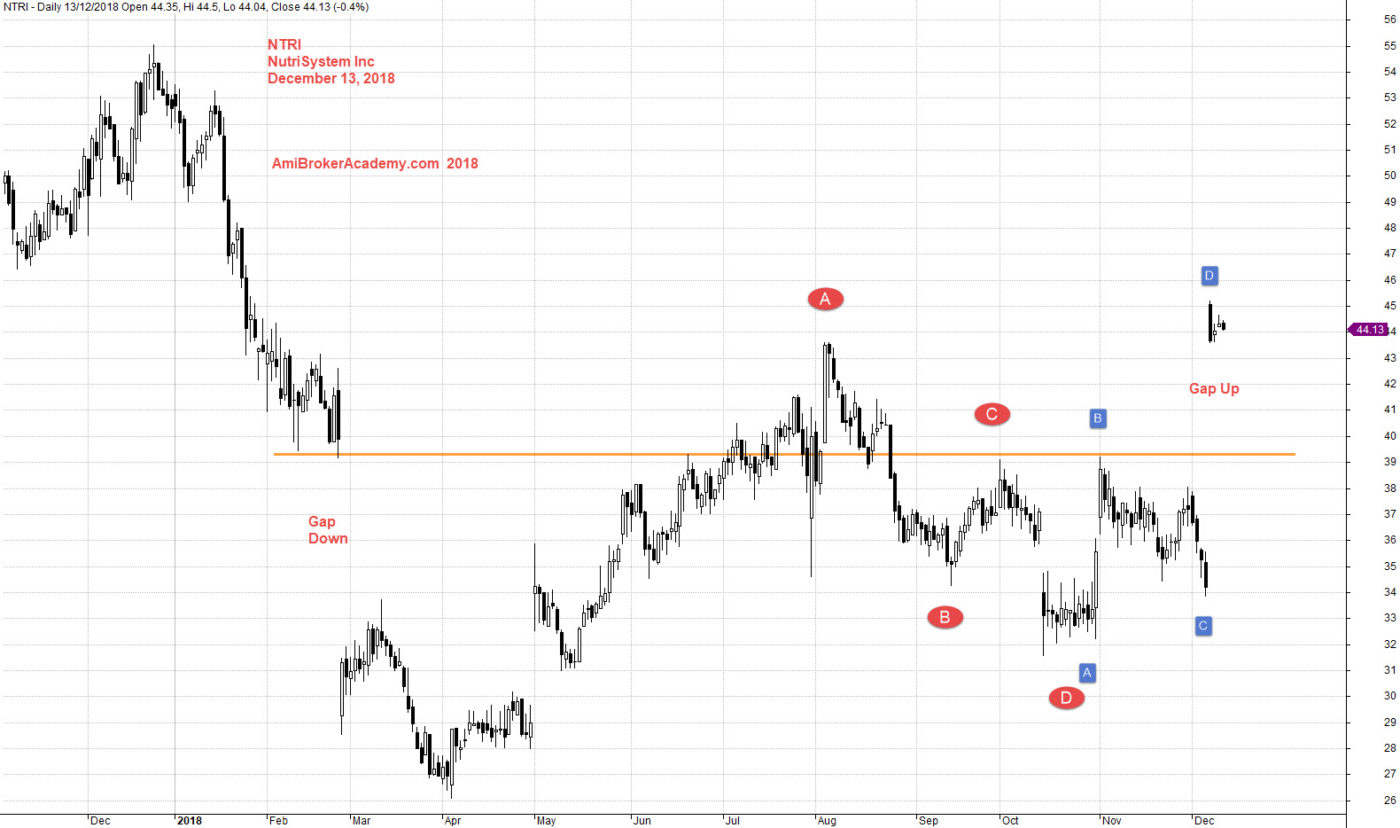
Study the chart from a H M Gartley 222 pattern.
See chart, picture worth a thousand words.
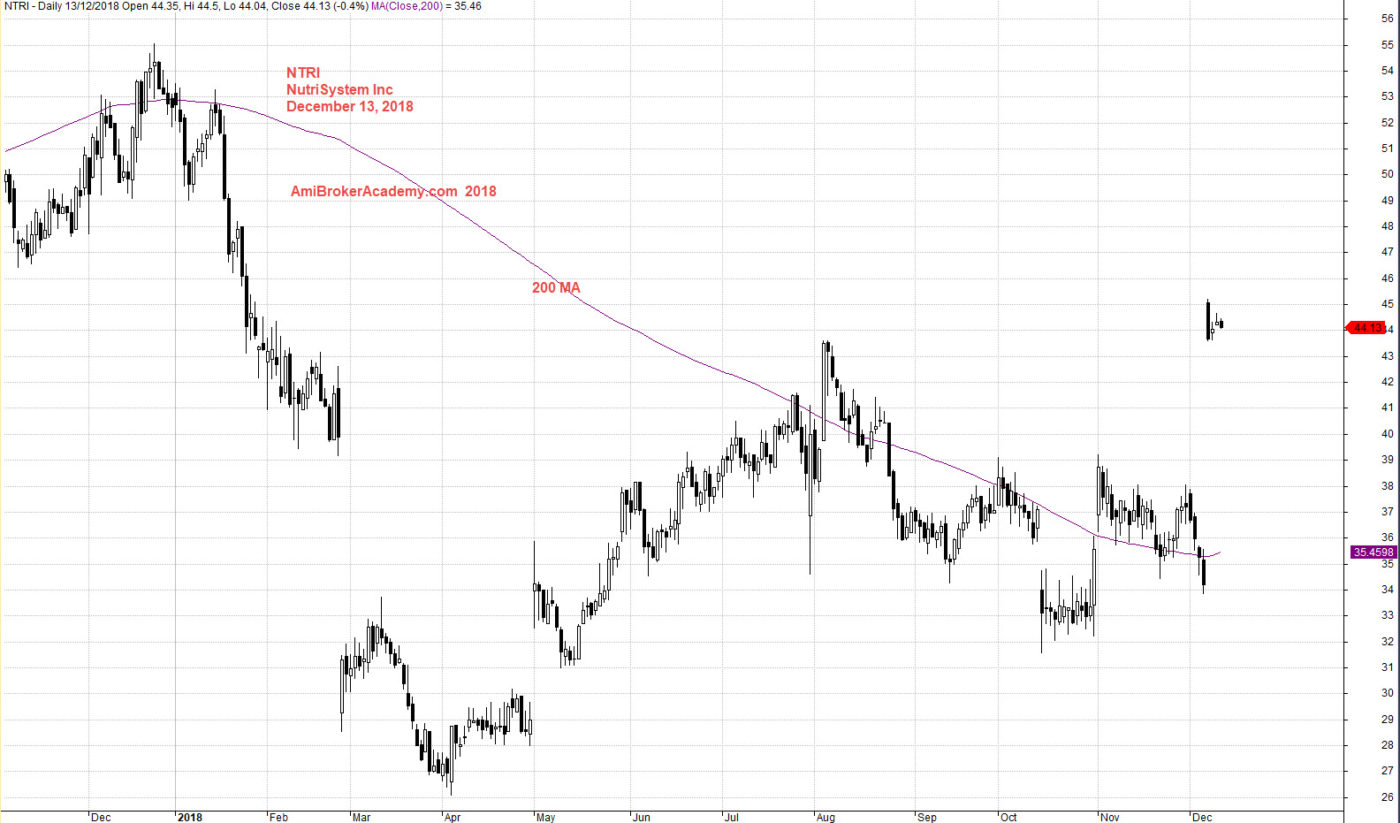
See chart, price action resisted by 200 MA and fail. The price action retest 200 MA again. But this time is a lower high. The price action continue to resisted by 200 MA. 200 MA is slopping down, bear trend.
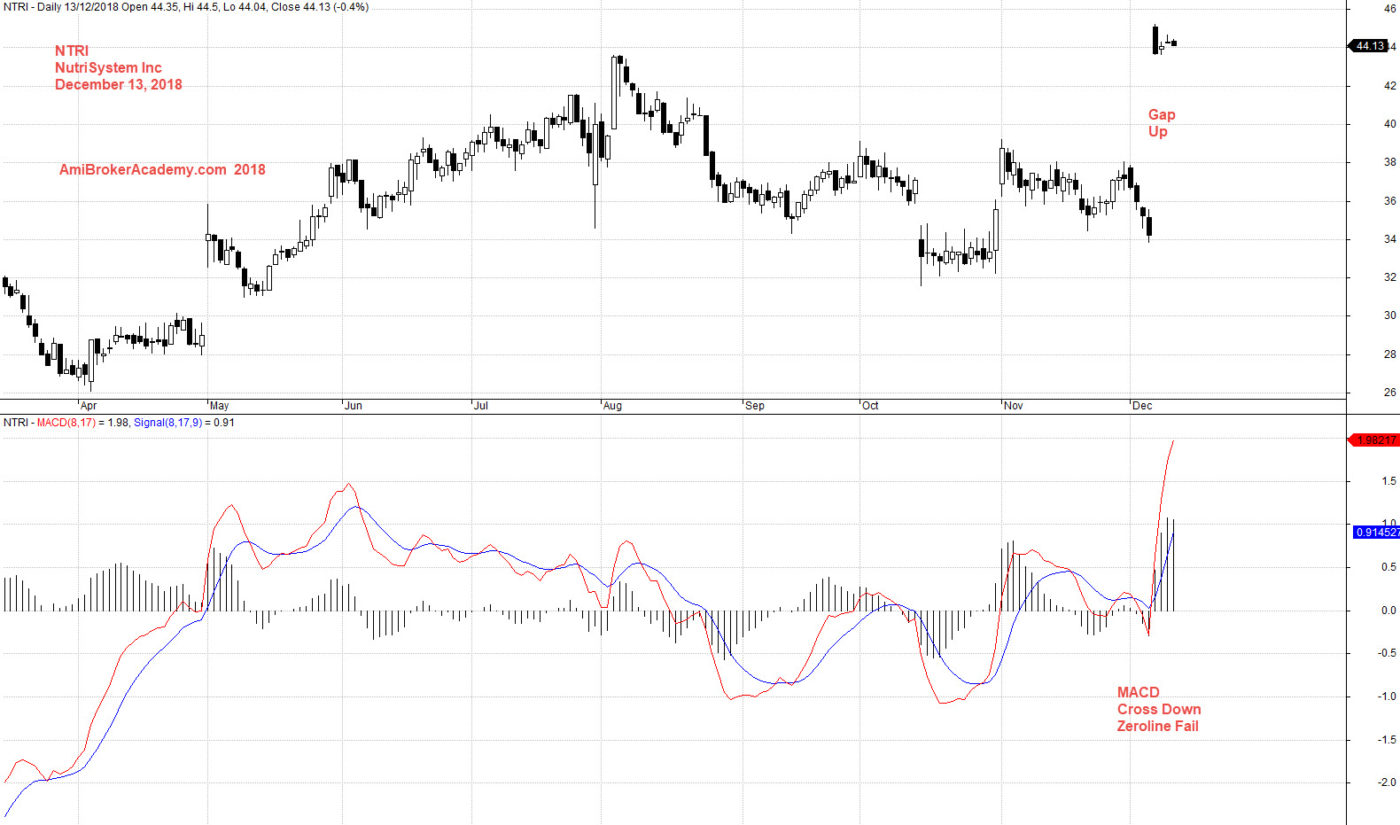
Add MACD indicator to the chart, see chart.
Moses US Stock Chart Analysis
AmiBrokerAcademy.com
Disclaimer
The above result is for illustration purpose. It is not meant to be used for buy or sell decision. We do not recommend any particular stocks. If particular stocks of such are mentioned, they are meant as demonstration of Amibroker as a powerful charting software and MACD. Amibroker can program to scan the stocks for buy and sell signals.
These are script generated signals. Not all scan results are shown here. The MACD signal should use with price action. Users must understand what MACD and price action are all about before using them. If necessary you should attend a course to learn more on Technical Analysis (TA) and Moving Average Convergence Divergence, MACD.
Once again, the website does not guarantee any results or investment return based on the information and instruction you have read here. It should be used as learning aids only and if you decide to trade real money, all trading decision should be your own.