3 January 2019
Think think got more things.
Thanks for visiting the site.
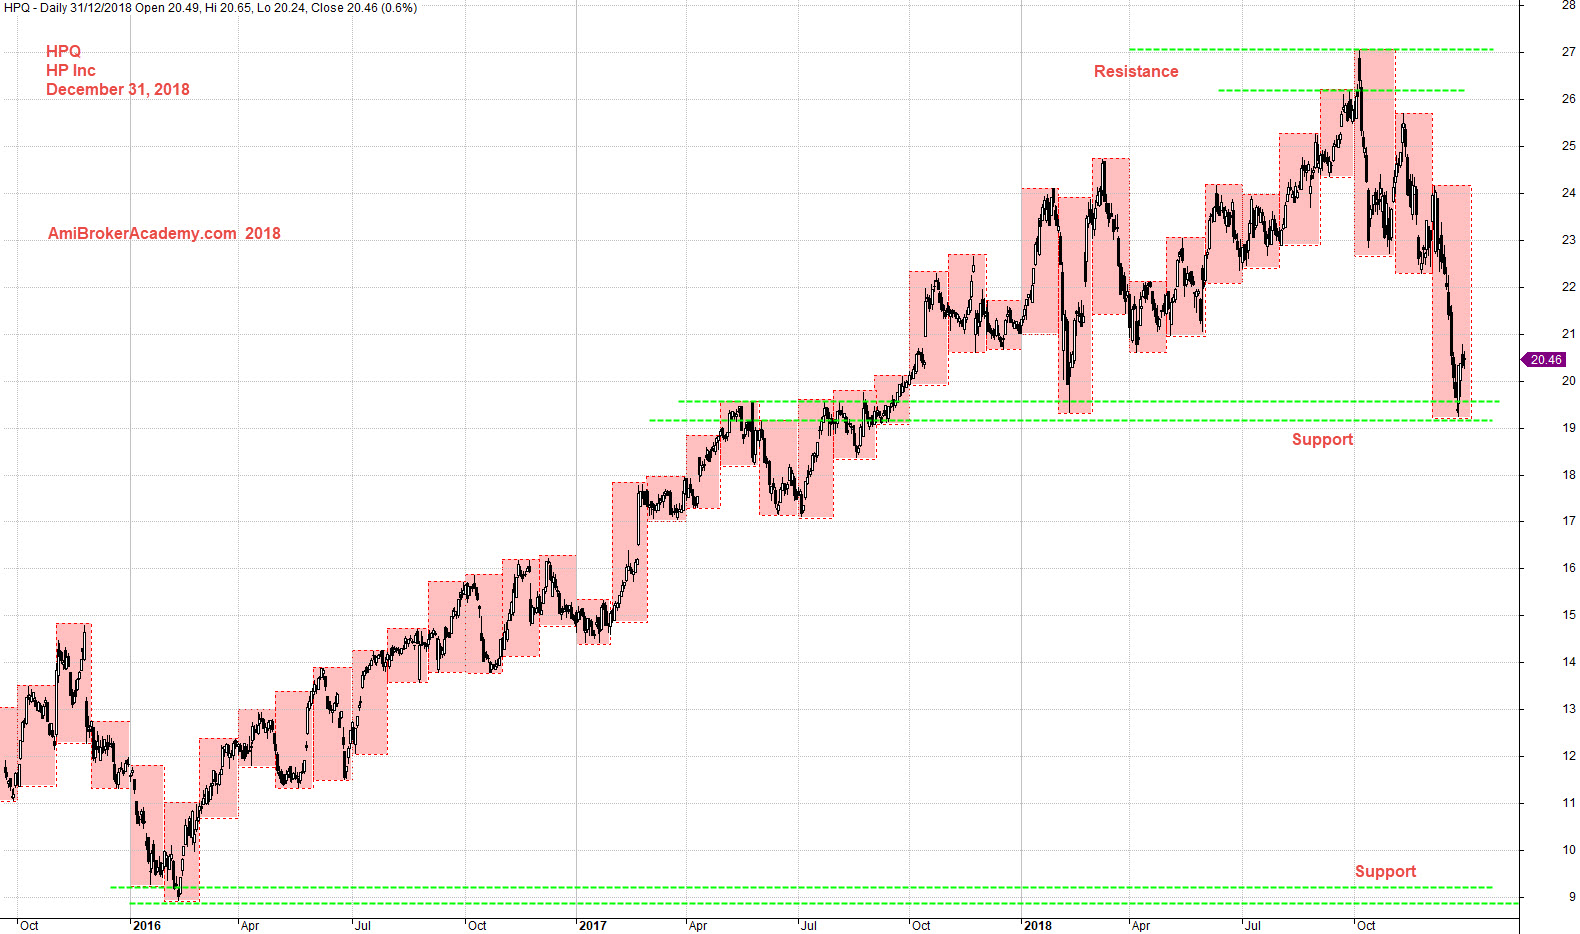
HPQ HP Inc Daily Chart
We believe in Buy Low Sell High
in other words Buy Support Sell Resistance
Study HP Inc chart, we see price action from resistance and continue to zigzag down since October.
Price action is supported by a key level.
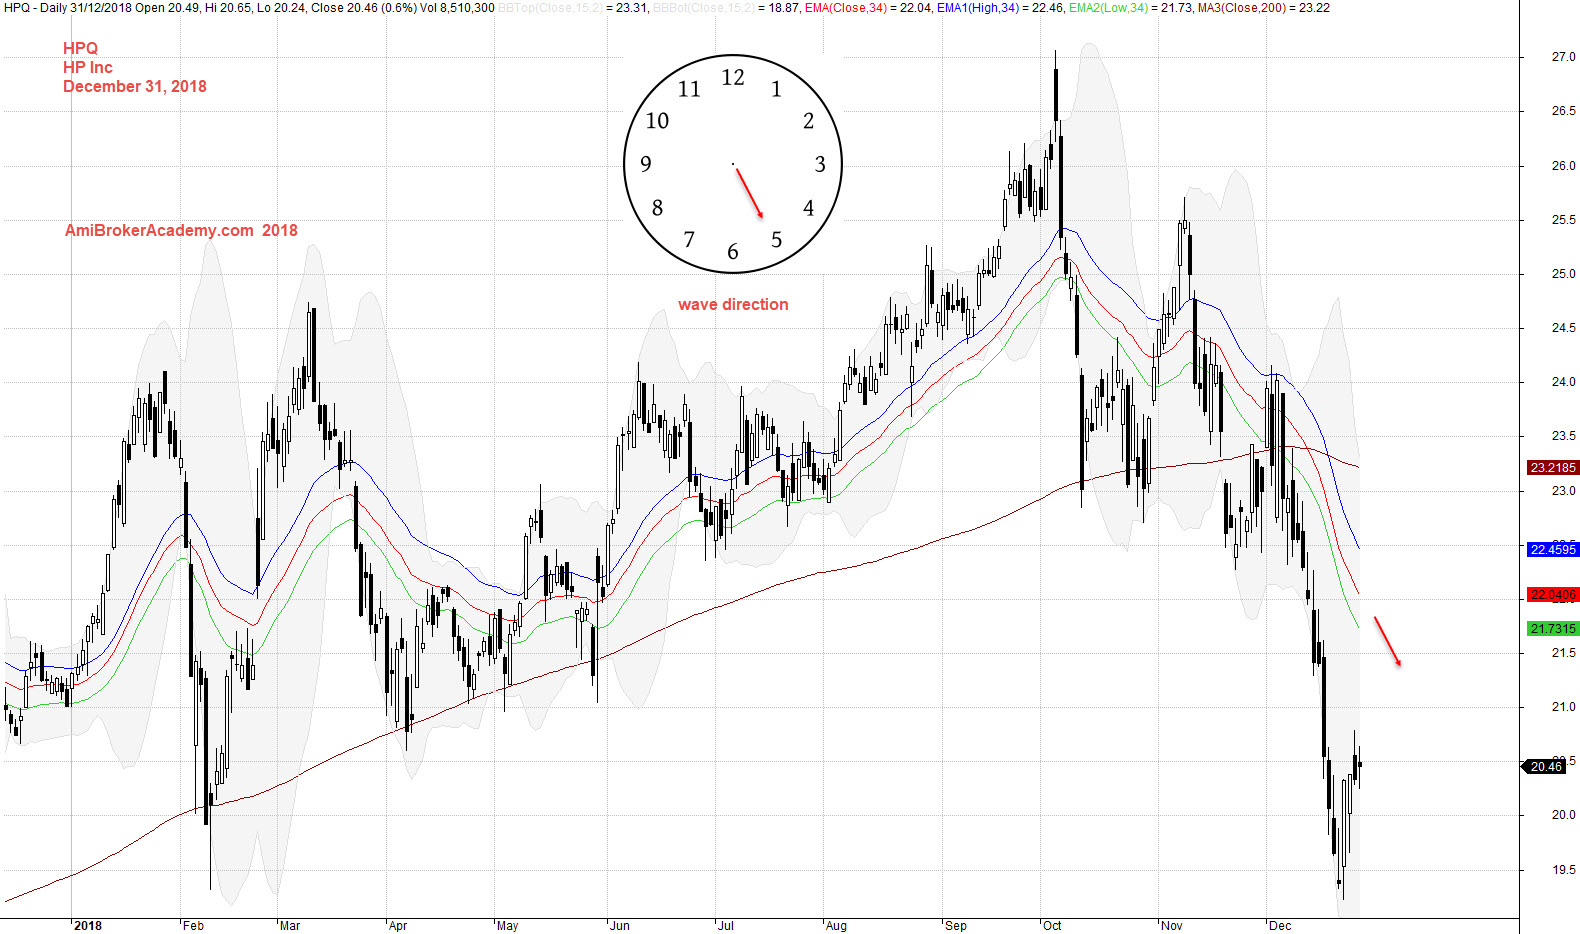
Trade with your eyes open.
if you can see the full chart, “press Ctrl and -” to zoom out and see the entire chart.
Moving Average is a great visual to spot the bull or bear trend of price action. See chart, the price action after crossing down below MA, and continue to stay below MA.
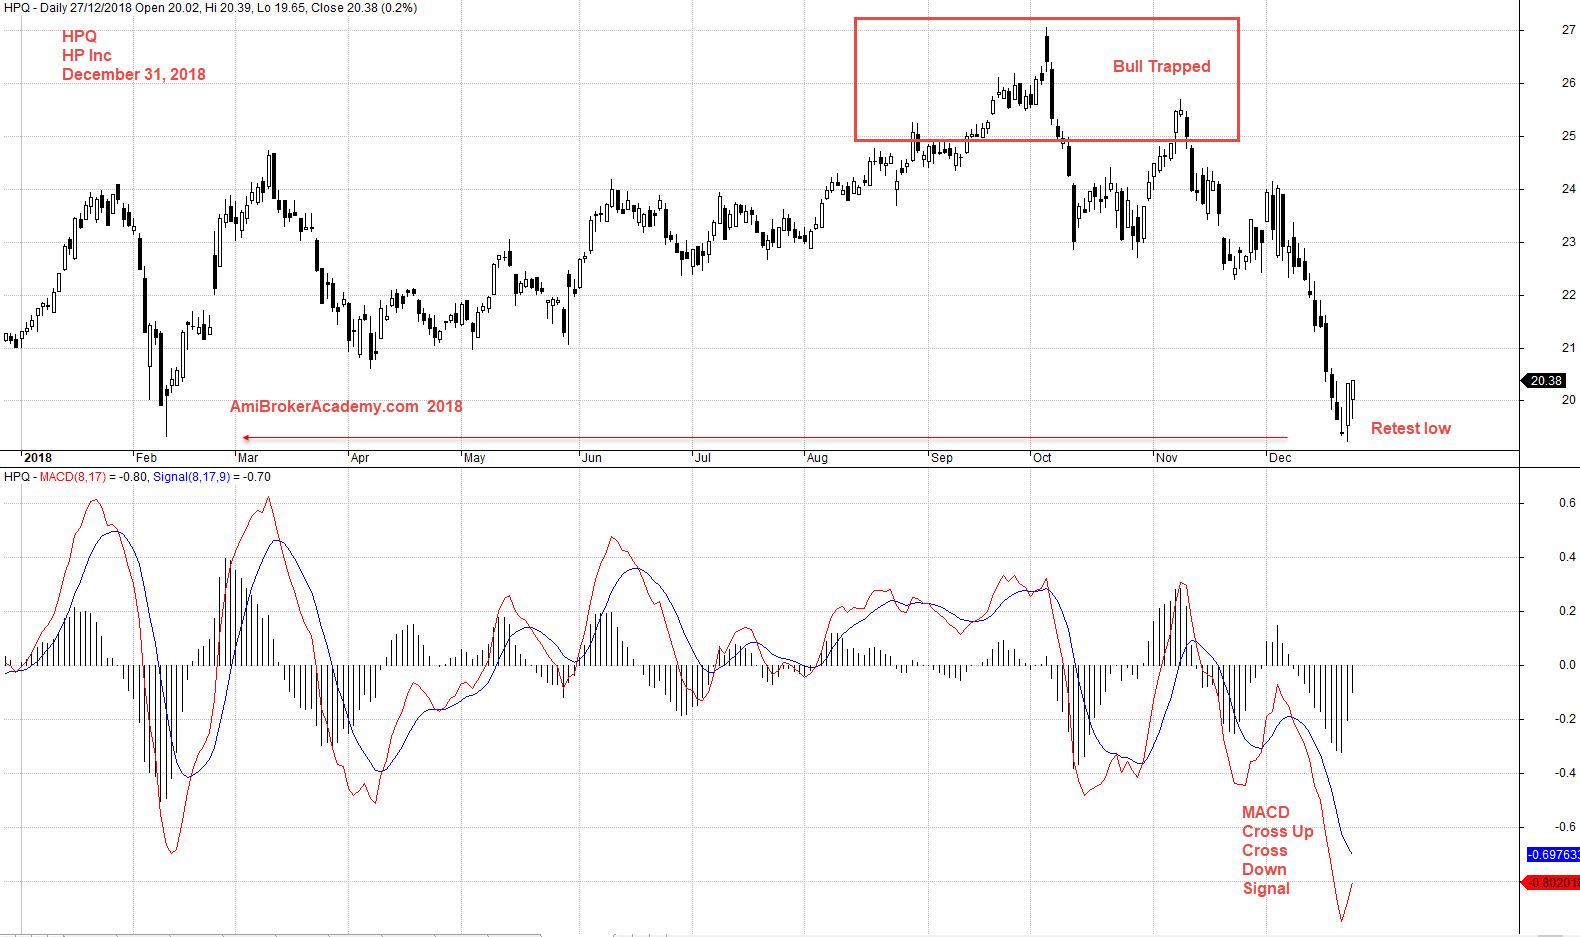
Add MACD indicator, see chart.
Moses US Stock Chart Analysis
AmiBrokerAcademy.com
Disclaimer
The above result is for illustration purpose. It is not meant to be used for buy or sell decision. We do not recommend any particular stocks. If particular stocks of such are mentioned, they are meant as demonstration of Amibroker as a powerful charting software and MACD. Amibroker can program to scan the stocks for buy and sell signals.
These are script generated signals. Not all scan results are shown here. The MACD signal should use with price action. Users must understand what MACD and price action are all about before using them. If necessary you should attend a course to learn more on Technical Analysis (TA) and Moving Average Convergence Divergence, MACD.
Once again, the website does not guarantee any results or investment return based on the information and instruction you have read here. It should be used as learning aids only and if you decide to trade real money, all trading decision should be your own.