29 May, 2018
The following are the 15 largest banks in U.S. by assets, the list was published by https://www.bankrate.com/.
- JPMorgan Chase & Co
- Bank of America Corporation
- Wells Fargo & Co
- Citigroup Inc
- Goldman Sachs Group Inc
- Morgan Stanley
- U.S. Bancorp
- TD Group US Holdings
- PNC Financial Services Group Inc
- Bank of New York Mellon Corporation
- Capital One Financial Corporation
- State Street Corp.
- BB&T Corporation
- SunTrust Banks Inc
- HSBC USA Inc
Goldman Sachs Group Inc ranked fifth by https://www.bankrate.com/.
US Stock Chart Analysis
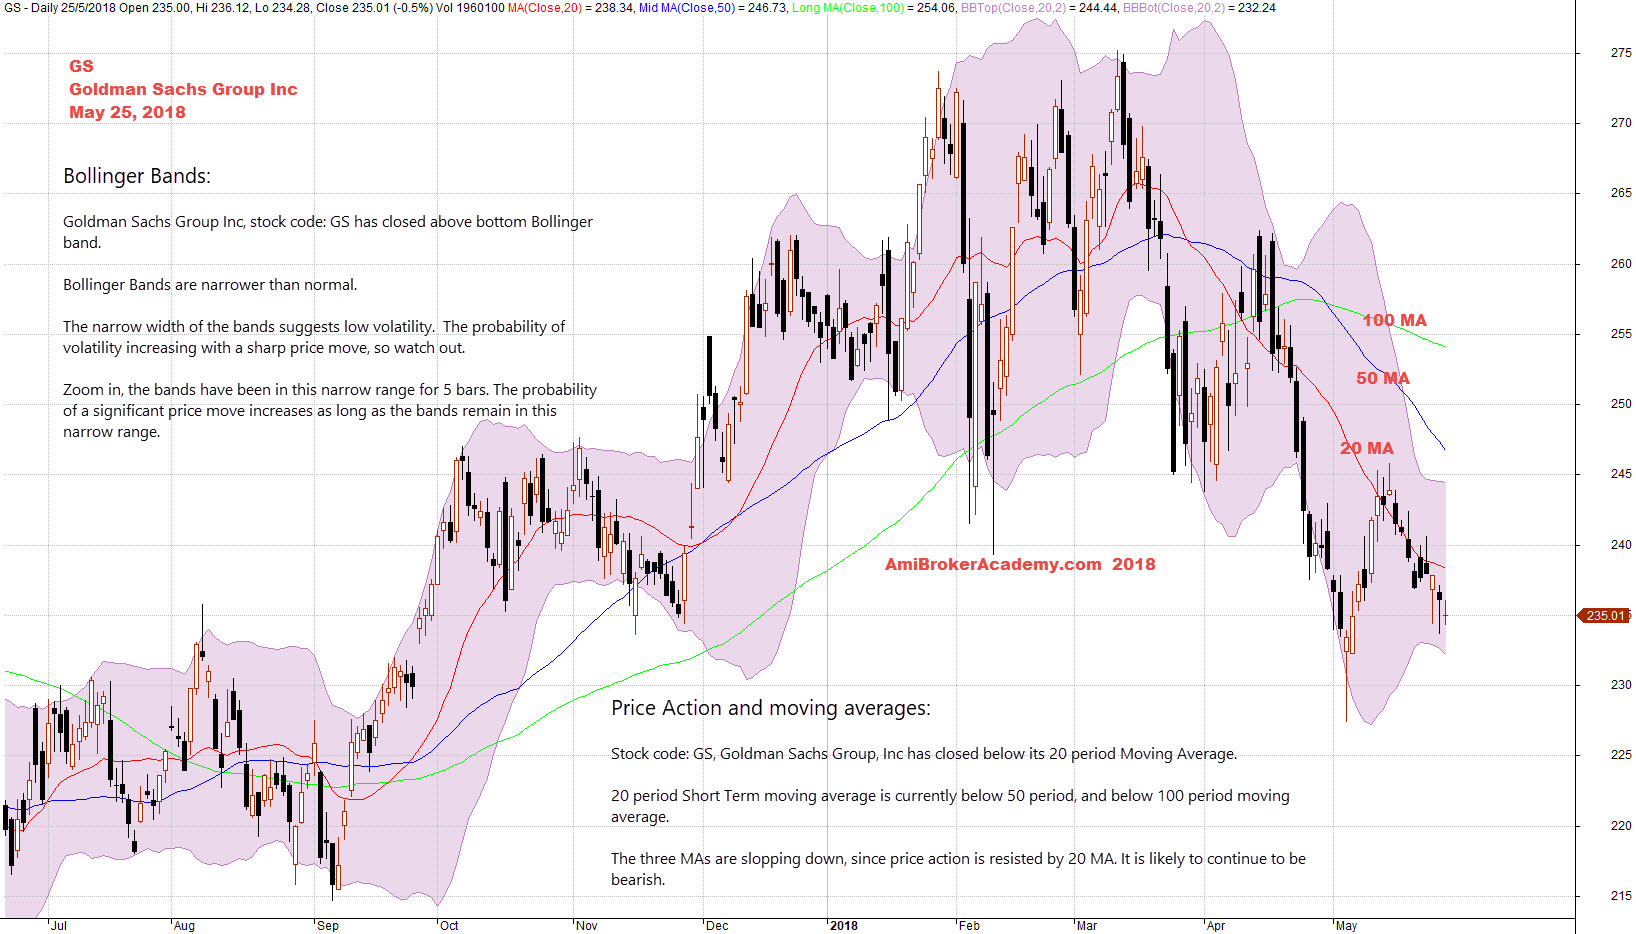
GS Goldman Sachs Group Inc and Moving Averages and Bollinger Bands
Picture worth a thousand words, see chart on Goldman Sachs Group Inc stock price.
Price Action and Moving Averages:
Stock code: GS, Goldman Sachs Group, Inc has closed below its 20 period Moving Average.
20 period Short Term moving average is currently below 50 period, and below 100 period moving average.
The three MAs are slopping down, since price action is resisted by 20 MA. It is likely to continue to be bearish.
Bollinger Bands:
Goldman Sachs Group Inc, stock code: GS has closed above bottom Bollinger band.
Bollinger Bands are narrower than normal.
The narrow width of the bands suggests low volatility. The probability of volatility increasing with a sharp price move, so watch out.
Zoom in, the bands have been in this narrow range for 5 bars. The probability of a significant price move increases as long as the bands remain in this narrow range.
Manage your risk!
May 25, 2018 Goldman Sachs Group Inc and Moving Average and Bollinger Bands
Moses US Stock Chart Analysis
AmiBrokerAcademy.com
Disclaimer
The above result is for illustration purpose. It is not meant to be used for buy or sell decision. We do not recommend any particular stocks. If particular stocks of such are mentioned, they are meant as demonstration of Amibroker as a powerful charting software and MACD. Amibroker can program to scan the stocks for buy and sell signals.
These are script generated signals. Not all scan results are shown here. The MACD signal should use with price action. Users must understand what MACD and price action are all about before using them. If necessary you should attend a course to learn more on Technical Analysis (TA) and Moving Average Convergence Divergence, MACD.
Once again, the website does not guarantee any results or investment return based on the information and instruction you have read here. It should be used as learning aids only and if you decide to trade real money, all trading decision should be your own.