March 22, 2018
Amazon is not just a online retail business, read the story from Amazon Web Services (AWS) – Cloud Computing Services.
US Stock Chart Analysis
AMZN Amazon.com Inc and Fibonacci
Study chart, we see Amazon.com Inc stock price keep going higher. From Fibonacci Extension from swing low o high, the price action has tested 127%. While other Tech Stocks that involve in data are facing the pressure of Facebook recent incident. Amazon.com on the other has involve with hosting type of similar that is more than most of us understand on the online retail business. Manage your risk.
Powerful Chart Software – AmiBroker
The following chart is produced using AmiBroker charting software. It is a powerful chart software. Anything, finance ticket you could download from Yahoo! Finance you could plot them, those you are interested all in a chart, so you could analyse them.
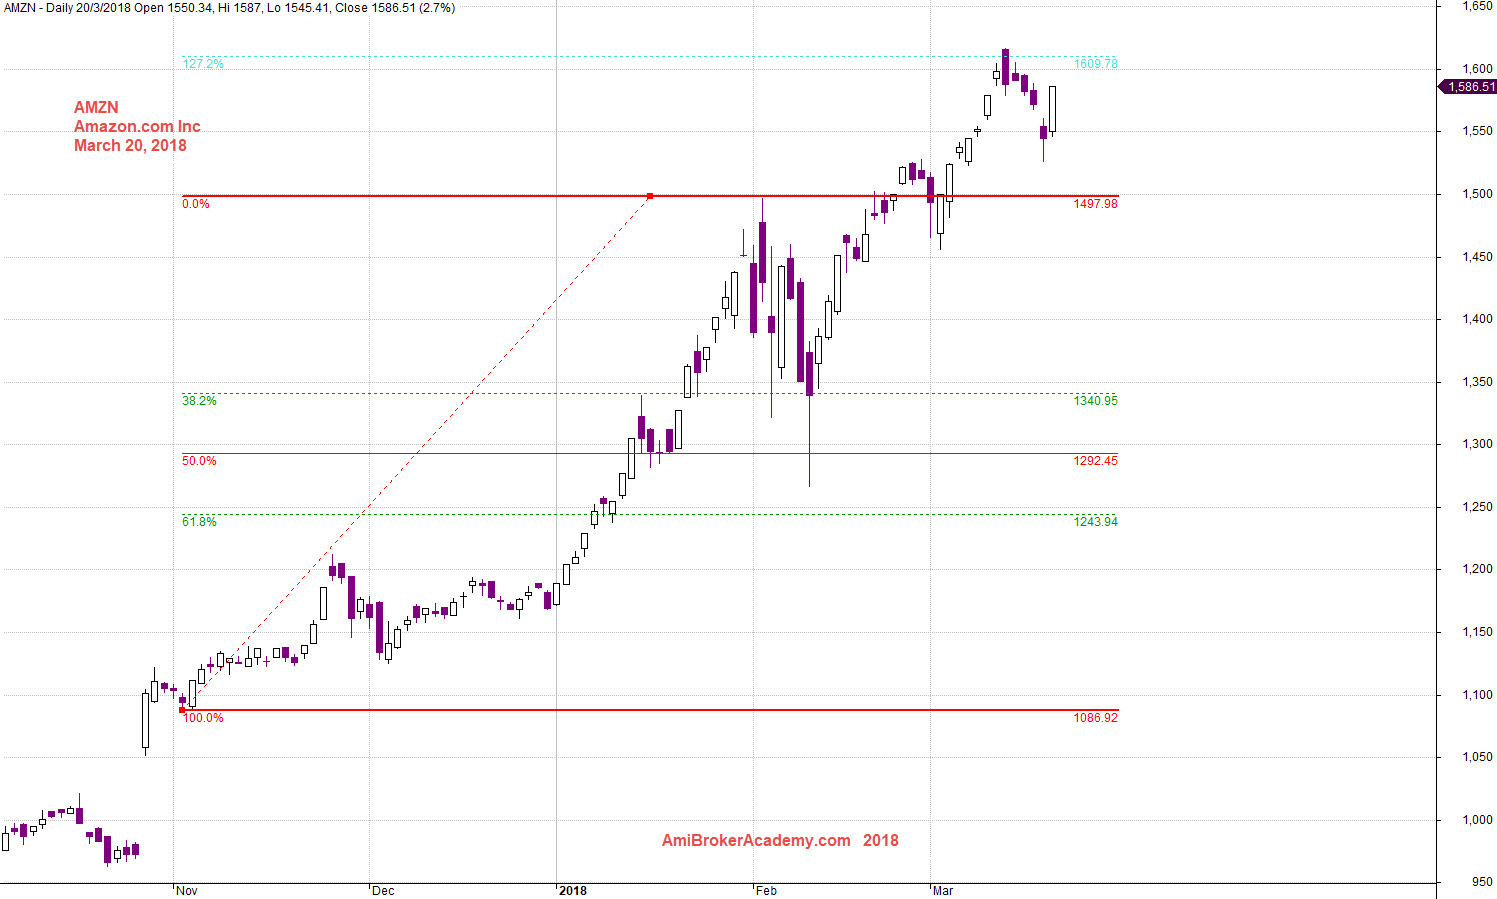
March 20, 2018 Amazon.com and Fibo Extension Low to High
Moses US Stock Chart Analysis
AmiBrokerAcademy.com
Disclaimer
The above result is for illustration purpose. It is not meant to be used for buy or sell decision. We do not recommend any particular stocks. If particular stocks of such are mentioned, they are meant as demonstration of Amibroker as a powerful charting software and MACD. Amibroker can program to scan the stocks for buy and sell signals.
These are script generated signals. Not all scan results are shown here. The MACD signal should use with price action. Users must understand what MACD and price action are all about before using them. If necessary you should attend a course to learn more on Technical Analysis (TA) and Moving Average Convergence Divergence, MACD.
Once again, the website does not guarantee any results or investment return based on the information and instruction you have read here. It should be used as learning aids only and if you decide to trade real money, all trading decision should be your own.