3 November, 2018
Thanks for visiting the site.
AAPL Apple Inc Daily Charting
Buy Support Sell Resistance
Buy Low Sell High
Study chart of Apple Inc Daily stock chart. If apply buy hold strategy for such stock see chart. It can be could hard for the heart too even you make money. If we take ten years as one trading block.
See chart, the price action from low to high and higher. The price action from near zero dollars to high above 30 dollars. And from 30 dollars to the high ot above 23o dollars. See the price action and chart.
If you are observing enough, there are many H M Gartley 222 pattern.
Remember trade with eyes open.
Think think got more things.
Manage your risk.
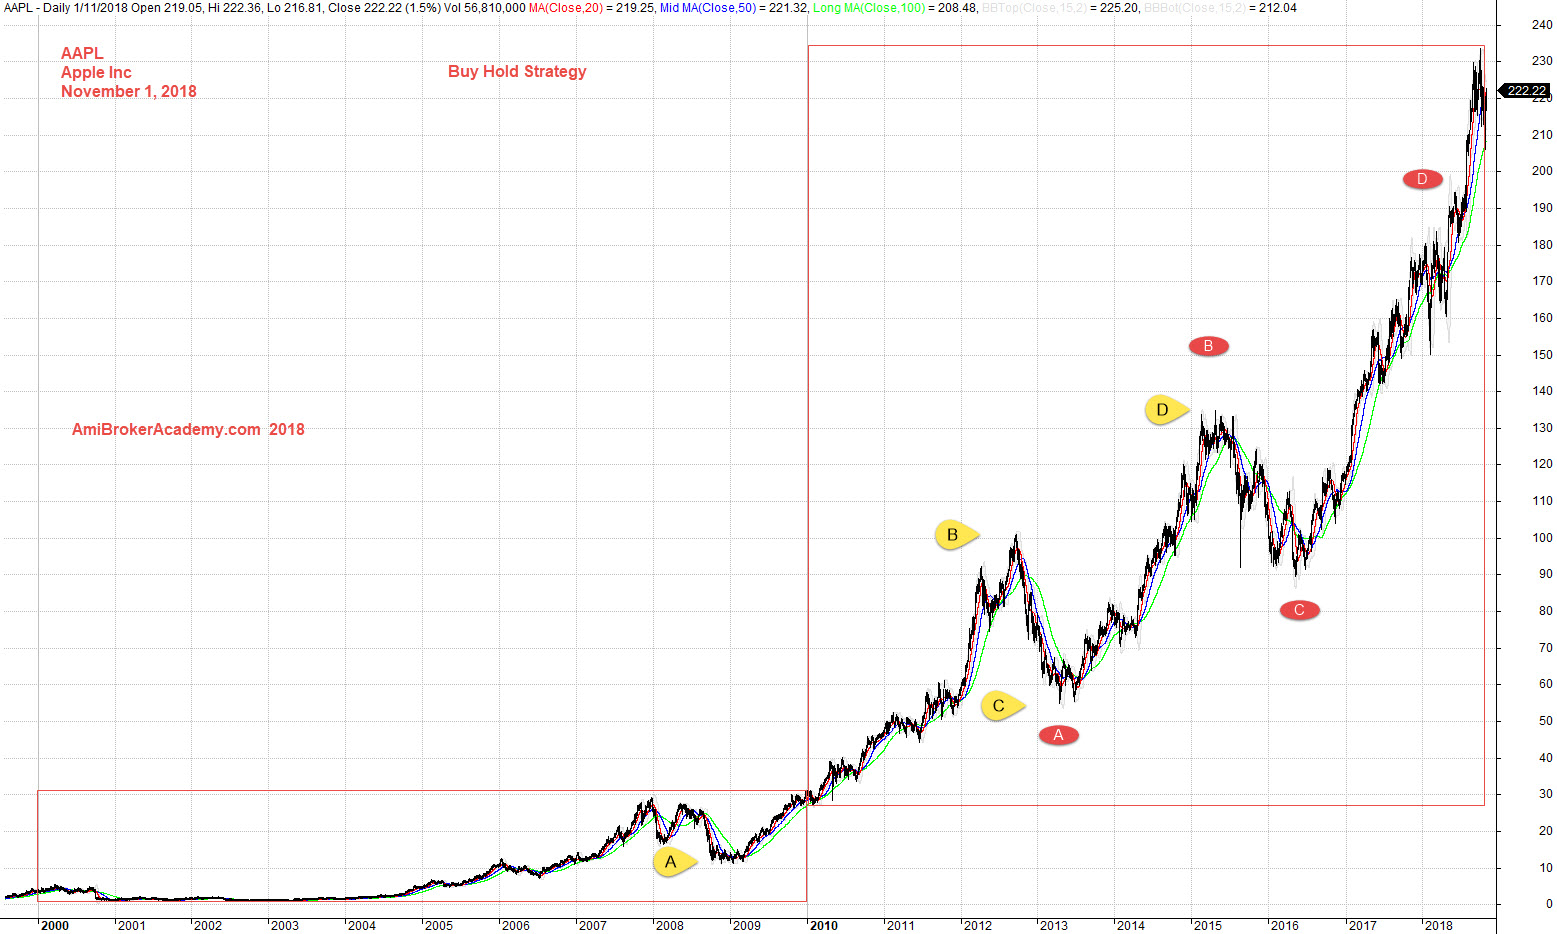
November 1, 2018 Apple Inc Buy Hold Strategy from 2000
if you can see the full chart, “press Ctrl and -” to zoom out and see the entire chart.
See support resistance and H M Gartley 222. See chart.
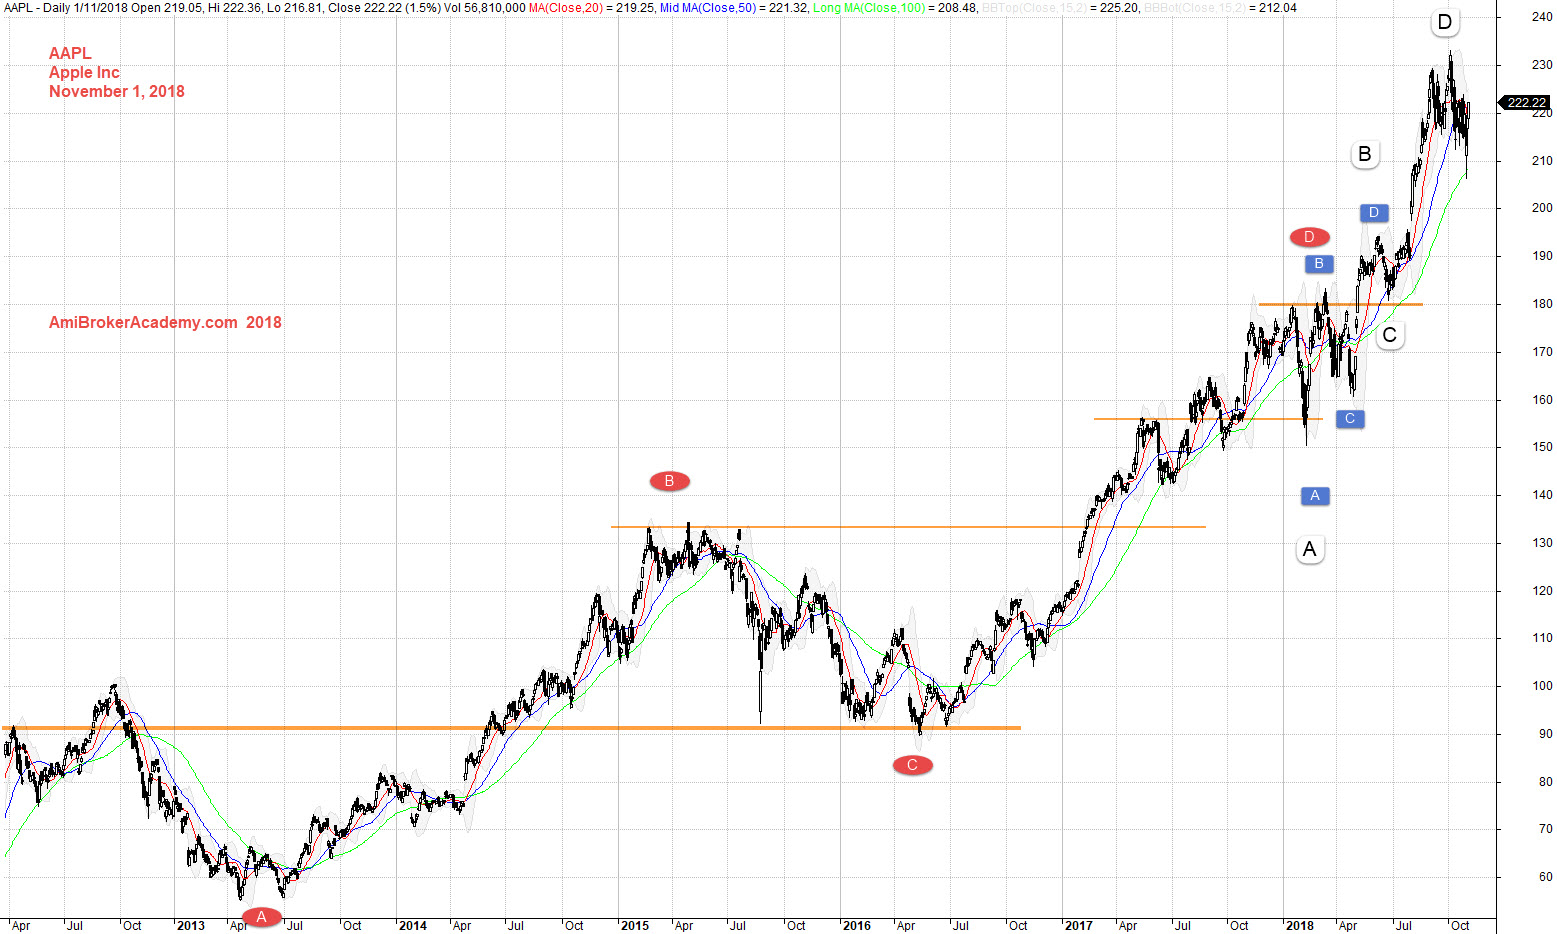
November 1, 2018 Apple Inc Zoom In Support Resistance
Moses US Stock Chart Analysis
AmiBrokerAcademy.com
Disclaimer
The above result is for illustration purpose. It is not meant to be used for buy or sell decision. We do not recommend any particular stocks. If particular stocks of such are mentioned, they are meant as demonstration of Amibroker as a powerful charting software and MACD. Amibroker can program to scan the stocks for buy and sell signals.
These are script generated signals. Not all scan results are shown here. The MACD signal should use with price action. Users must understand what MACD and price action are all about before using them. If necessary you should attend a course to learn more on Technical Analysis (TA) and Moving Average Convergence Divergence, MACD.
Once again, the website does not guarantee any results or investment return based on the information and instruction you have read here. It should be used as learning aids only and if you decide to trade real money, all trading decision should be your own.