20 September, 2018
Thanks for visiting the site.
AAOI Applied Optoelectronics Inc Charting
Buy Support Sell Resistance or Buy Low Sell High
Study chart of Applied Optoelectronics Inc price action. See price action from IPO, you can see AAOI goes IPO to high and retest at IPO price in 2015, in 2016. Then the price action breakout and move higher. The stock price goes from as low as ten to the high of one hundred. However, if you did not take profit when the price action breakout below bull trendline. You are mad now, as the stock price returns above 30 dollars only.
Trade with eyes open.
Manage your risk.
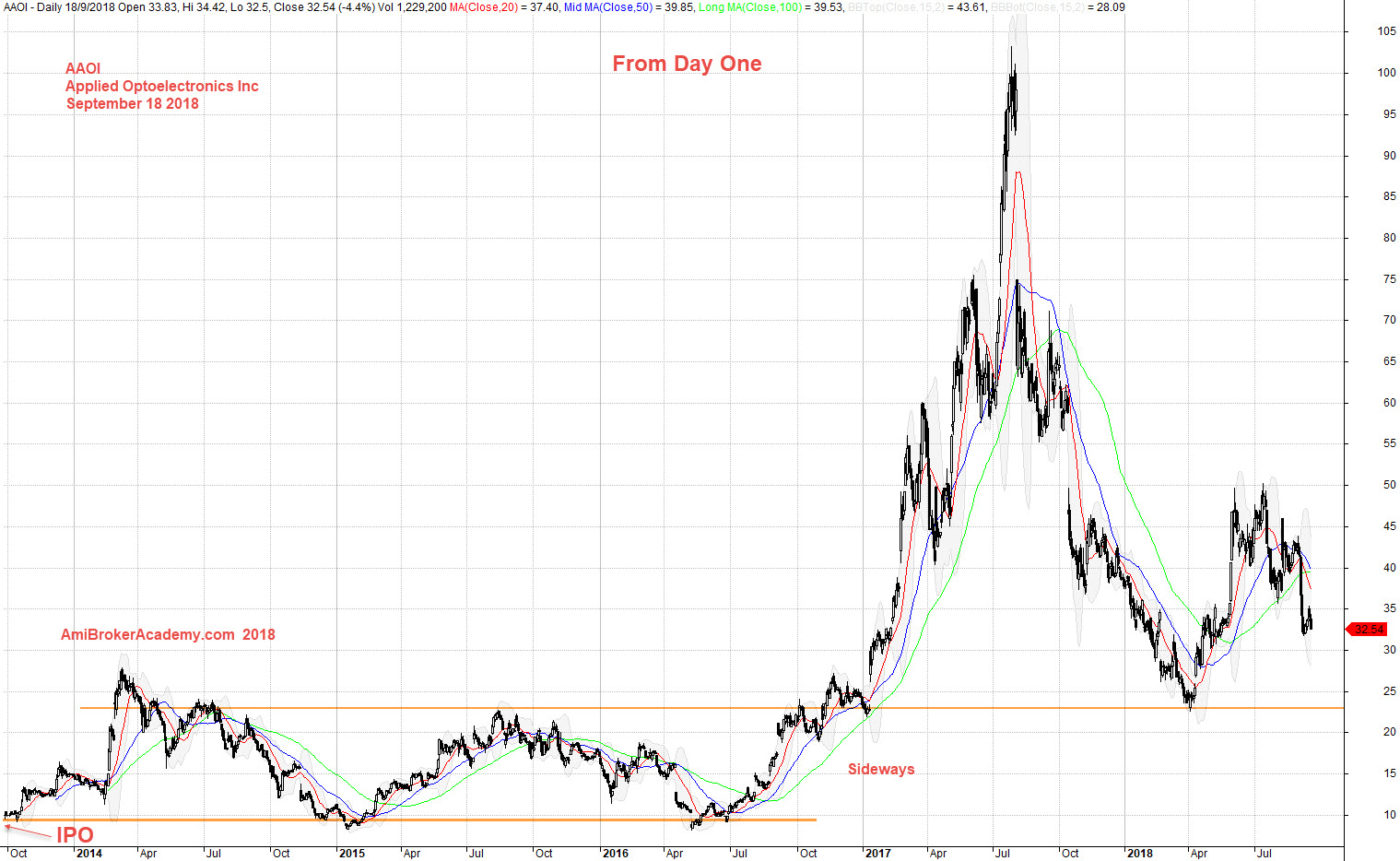
September 18, 2018 Applied Optoelectronics Inc From Day One
if you can see the full chart, “press Ctrl and -” to zoom out and see the entire chart.
Add MACD indicator, see chart picture worth a thousand words. Trade with eyes open.
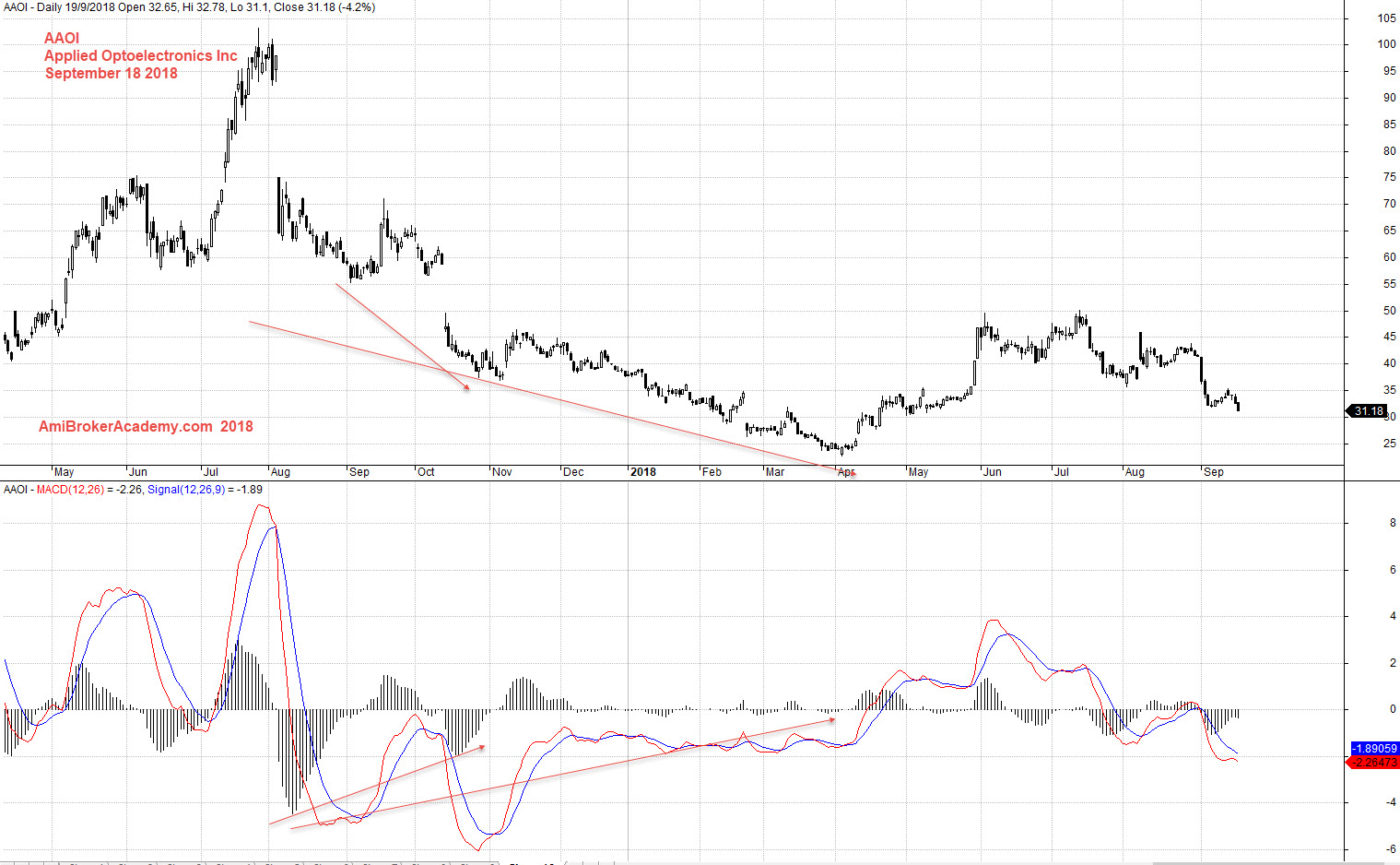
September 18, 2018 Applied Optoelectronics Inc and MACD
Moses US Stock Chart Analysis
AmiBrokerAcademy.com
Disclaimer
The above result is for illustration purpose. It is not meant to be used for buy or sell decision. We do not recommend any particular stocks. If particular stocks of such are mentioned, they are meant as demonstration of Amibroker as a powerful charting software and MACD. Amibroker can program to scan the stocks for buy and sell signals.
These are script generated signals. Not all scan results are shown here. The MACD signal should use with price action. Users must understand what MACD and price action are all about before using them. If necessary you should attend a course to learn more on Technical Analysis (TA) and Moving Average Convergence Divergence, MACD.
Once again, the website does not guarantee any results or investment return based on the information and instruction you have read here. It should be used as learning aids only and if you decide to trade real money, all trading decision should be your own.