March 29, 2018
What You Miss?
When have time, look back look to the left and see the miss and gain of your opportunity.
US Stock Chart Analysis
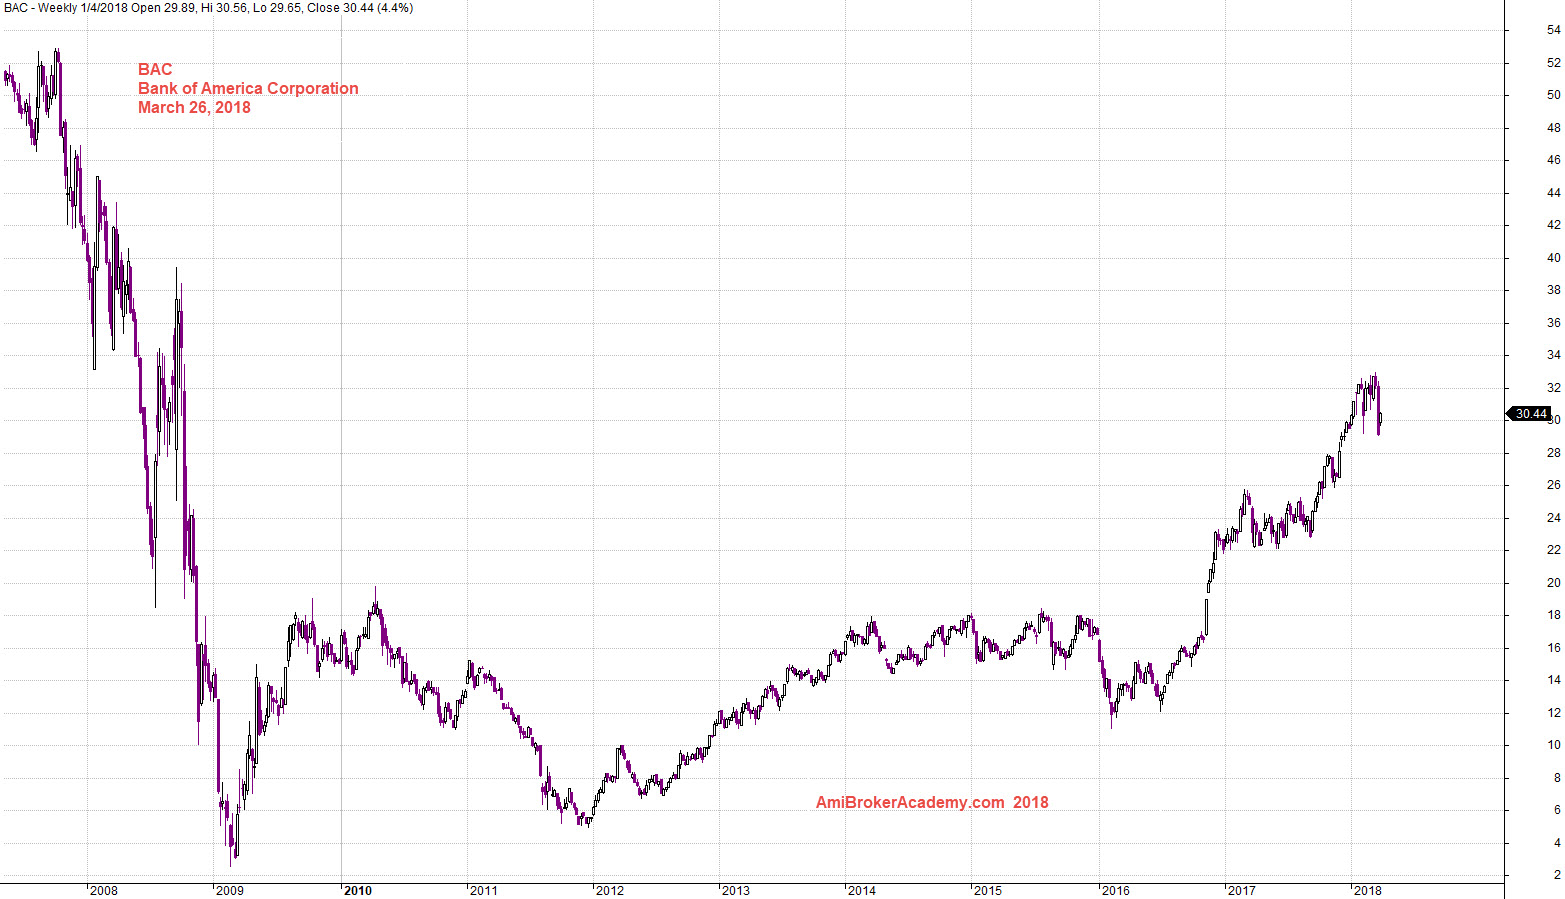
BAC Bank of America Corporation Chart from 2008
Study the chart of Bank of America stock price, the stock fallen from the high near 54 dollars to the low of close to 2 dollars during the Great Recession. The Fear was so high. The stock slowly makes it way up, now the stock price is below 34 dollars. No bad right.
If you are those that strong heart, bought the stock near five after 2008, and you did not sell off and cash in near 20 at two years later. You may be bad at yourself. One more time, if you bought the stock in 2011 again near five dollars and hold it till now. You probably be very happy.
Again, all can buy the stock at five dollars, but the results are all different. So, be happy on your own home work and returns. Have fun!
Manage your risk.
Powerful Chart Software – AmiBroker
The following chart is produced using AmiBroker charting software. It is a powerful chart software. Anything, finance ticket you could download from Yahoo! Finance you could plot them, those you are interested all in a chart, so you could analyse them.
The further you can download from Yahoo! Finance is 1970. Enjoy your learning.
March 26, 2018 Bank of America Charting From 2008
Moses US Stock Chart Analysis
AmiBrokerAcademy.com
Disclaimer
The above result is for illustration purpose. It is not meant to be used for buy or sell decision. We do not recommend any particular stocks. If particular stocks of such are mentioned, they are meant as demonstration of Amibroker as a powerful charting software and MACD. Amibroker can program to scan the stocks for buy and sell signals.
These are script generated signals. Not all scan results are shown here. The MACD signal should use with price action. Users must understand what MACD and price action are all about before using them. If necessary you should attend a course to learn more on Technical Analysis (TA) and Moving Average Convergence Divergence, MACD.
Once again, the website does not guarantee any results or investment return based on the information and instruction you have read here. It should be used as learning aids only and if you decide to trade real money, all trading decision should be your own.