November 8, 2018
Thanks for visiting the site.
Moses Stock Analysis
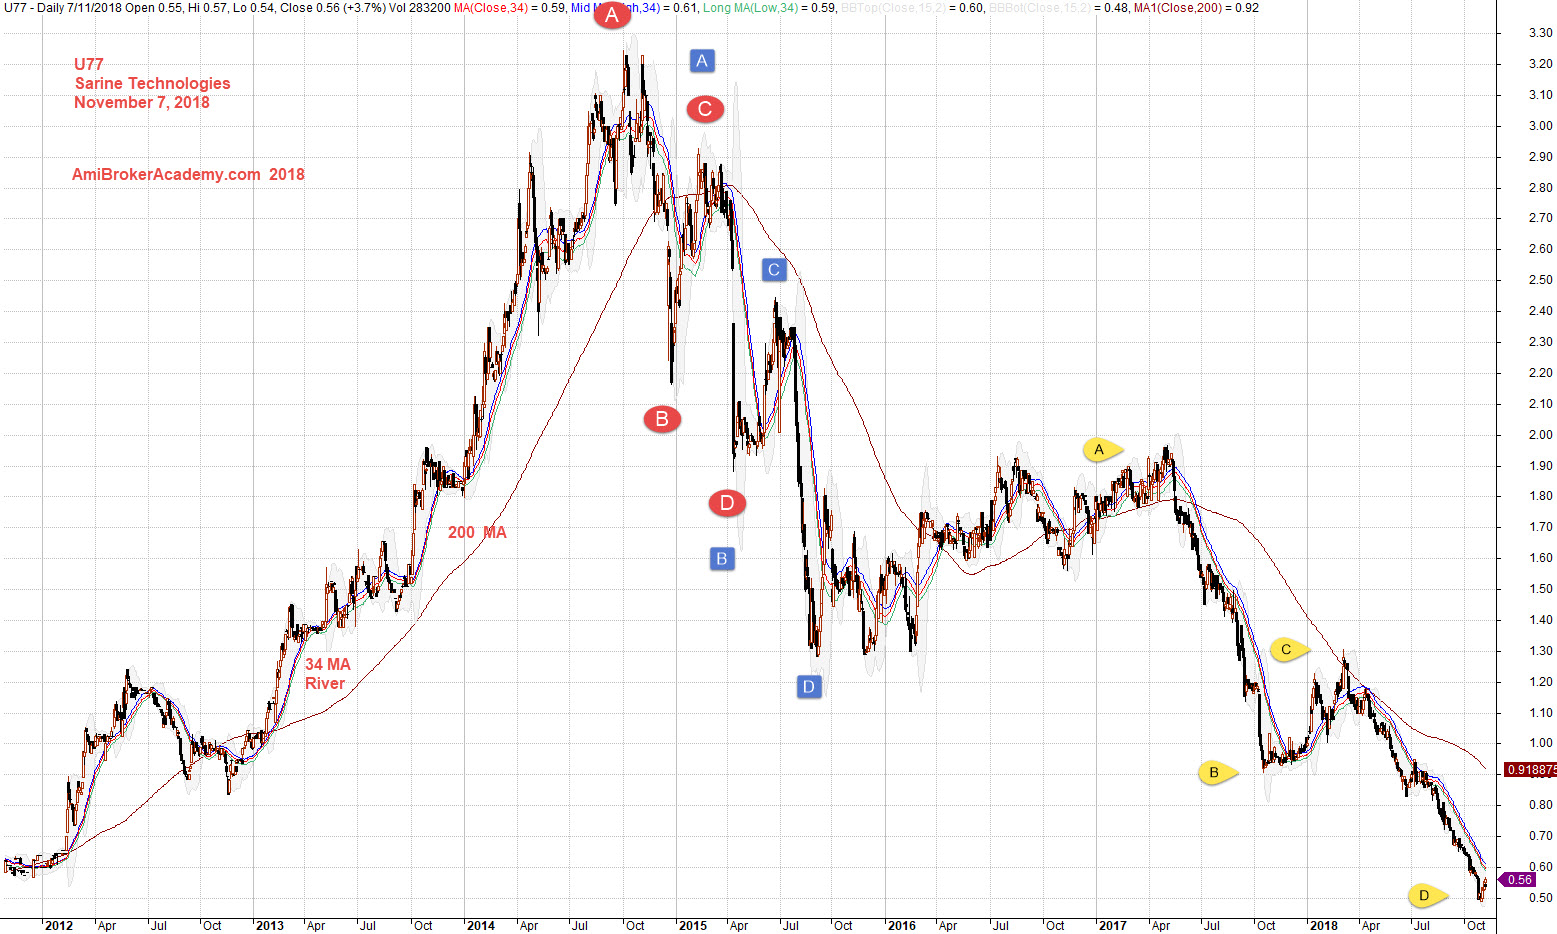
U77 Sarine Technologies Stock Charting
Buy low sell high, buy support sell resistance.
See chart, the price action of Sarine Technologies stock chart.
Apply buy low sell high and buy hold strategy. For this stock it is really not easy, the stock price goes from the low above 50 cents and return to 50 cents again. The price action goes up to test the high near 3.3 dollars, and fail and test the low near 19 dollars and further low at 1.30 dollars before the price action test the high near 2.0 dollar. The stock price rebounce to 2 dollars can not hold, finally with a clear ABCD, the price action test the low at 50 cents. Trade with eyes open. Manage your risk.
November 7, 2018 Sarine Technologies and River
See chart, we add MACD indicator, picture worth a thousand words.
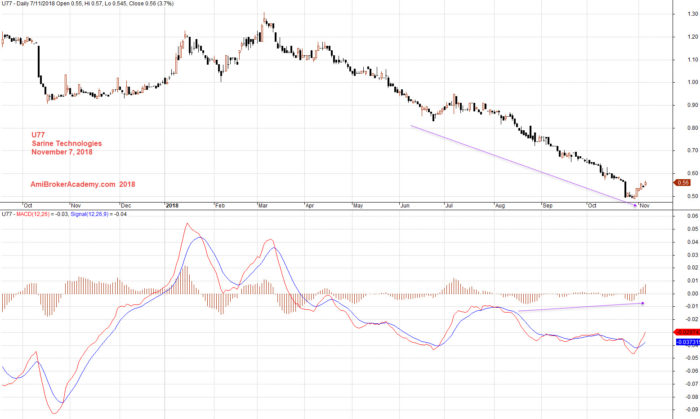
November 7, 2018 Sarine Technologies and MACD
Moses
AmiBrokerAcademy.com
Disclaimer
The above result is for illustration purpose. It is not meant to be used for buy or sell decision. We do not recommend any particular stocks. If particular stocks of such are mentioned, they are meant as demonstration of Amibroker as a powerful charting software and MACD. Amibroker can program to scan the stocks for buy and sell signals.
These are script generated signals. Not all scan results are shown here. The MACD signal should use with price action. Users must understand what MACD and price action are all about before using them. If necessary you should attend a course to learn more on Technical Analysis (TA) and Moving Average Convergence Divergence, MACD.
Once again, the website does not guarantee any results or investment return based on the information and instruction you have read here. It should be used as learning aids only and if you decide to trade real money, all trading decision should be your own.