15 July, 2018
Thanks for visiting the site.
U.S. Stock Chart Analysis
NEOG Neogen Corporation Stock Charting and Stochastic
Study the stock chart of Neogen Corporation, you see the price action continue to move higher, see chart on Stochastic. The slow Stochastic has slopped up and stayed at overbought. And it is likely the Slow Stochastic is going to stay at that zone for a while. See chart, you will notic that that the fast stochastic is zigzag between the oversold and overbought region. That reflects on the price action.
Trade with eyes open and manage your risk.
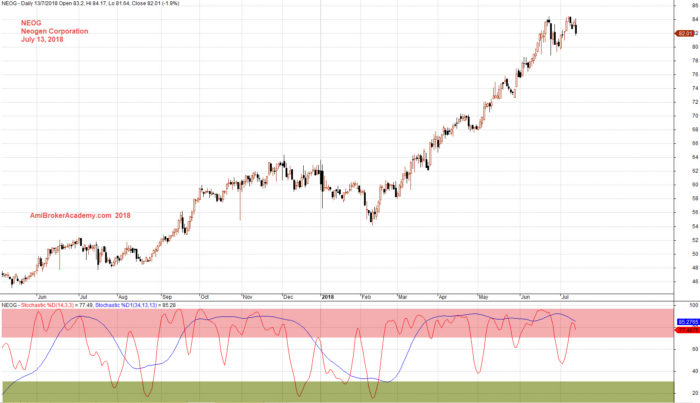
July 13, 2018 Neogen Corporation and Stochastic
NEOG Neogen Corporation Stock Charting and Sideways
See chart, picture worth a thousand words. Take note on the boxes. The boxes indicate the sideways movement. The breakout show the bullish trending.
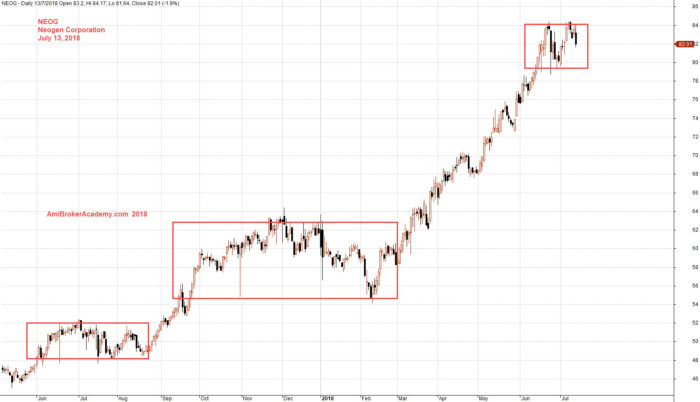
July 13, 2018 Neogen Corporation and Sideways
NEOG Neogen Corporation Stock Charting and Waves
See chart, picture worth a thousand words. Take note on 34 period moving average band. The price action stays above the MA band while bullish trend, the move sideways when the price action is zigzag across the MA Band. Counting the wave on the chart, you see wave 1, 2, 3, 4 and 5. The trend is very bullish.
Trade with eyes open. Manage your trade.
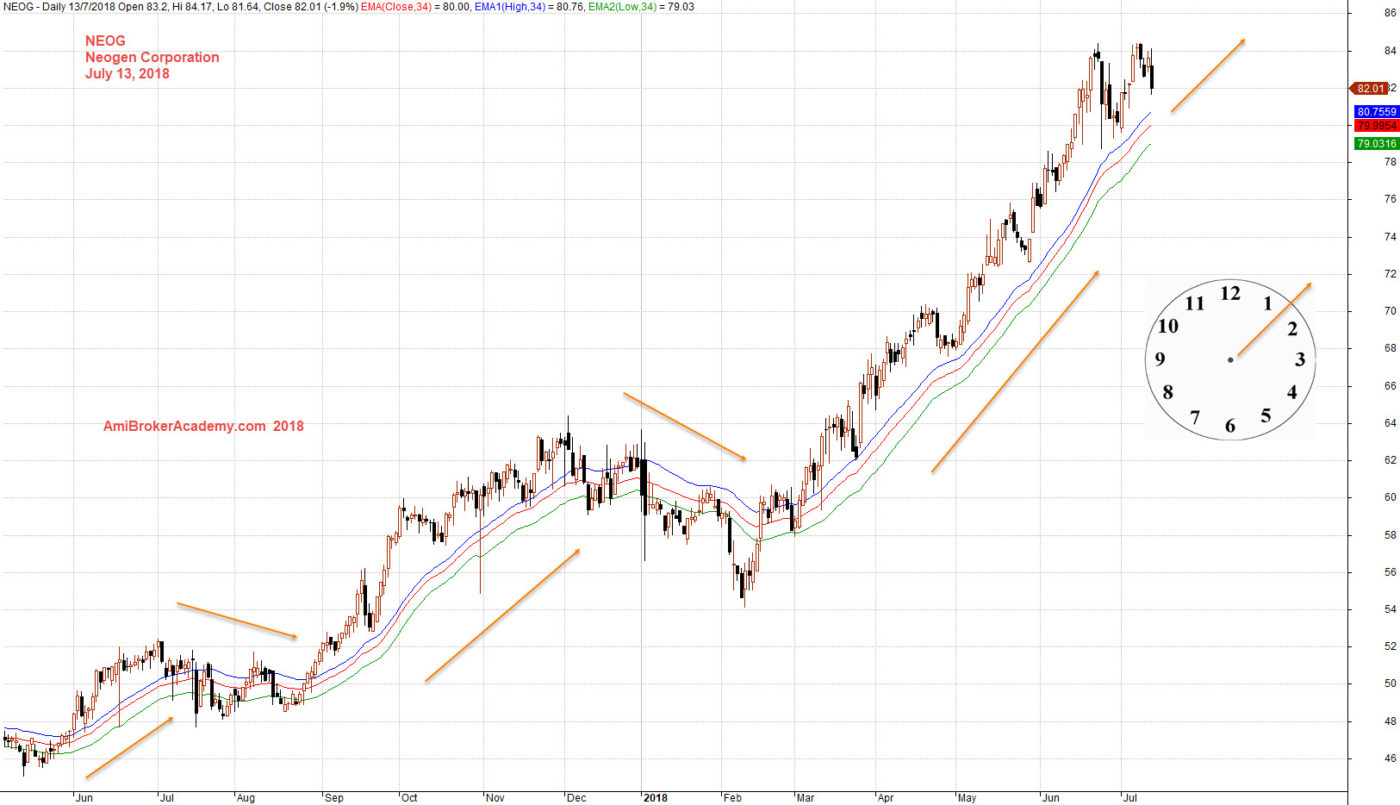
July 13, 2018 Neogen Corporation and Wave
Moses US Stock Chart Analysis
AmiBrokerAcademy.com
Disclaimer
The above result is for illustration purpose. It is not meant to be used for buy or sell decision. We do not recommend any particular stocks. If particular stocks of such are mentioned, they are meant as demonstration of Amibroker as a powerful charting software and MACD. Amibroker can program to scan the stocks for buy and sell signals.
These are script generated signals. Not all scan results are shown here. The MACD signal should use with price action. Users must understand what MACD and price action are all about before using them. If necessary you should attend a course to learn more on Technical Analysis (TA) and Moving Average Convergence Divergence, MACD.
Once again, the website does not guarantee any results or investment return based on the information and instruction you have read here. It should be used as learning aids only and if you decide to trade real money, all trading decision should be your own.