June 3, 2017
Moses Stock Analysis
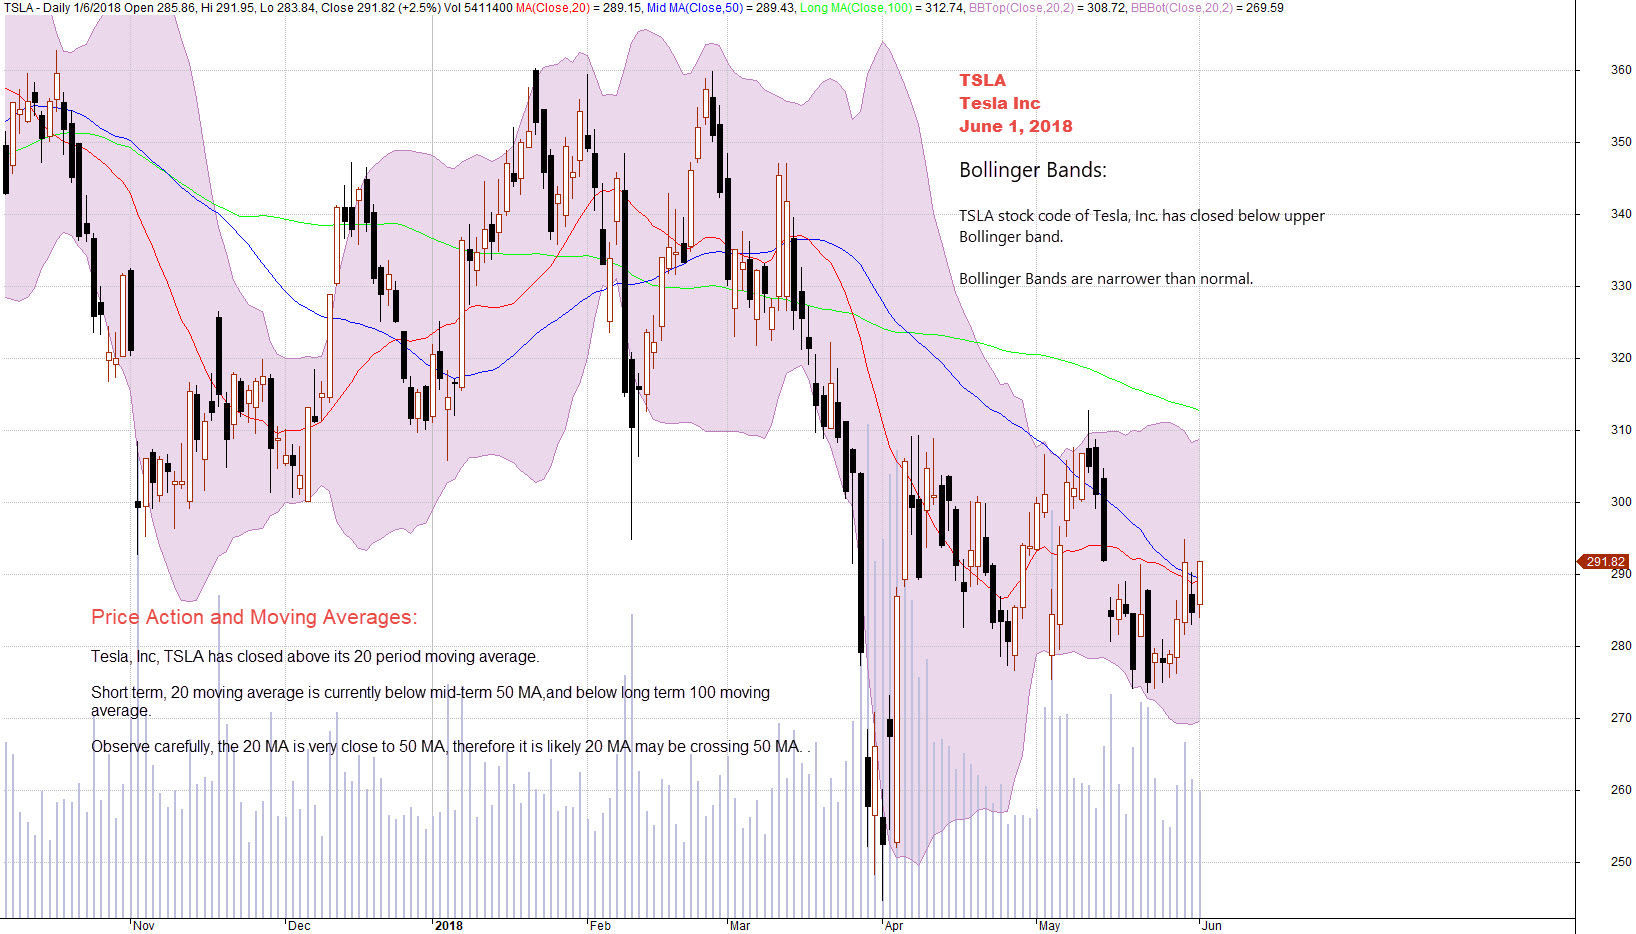
TSLA Tesla Inc Stock Charting
Picture worth a thousand words, see chart.
Bollinger Bands:
TSLA stock code of Tesla, Inc. has closed below upper Bollinger band.
Bollinger Bands are narrower than normal.
Price Action and Moving Averages:
Tesla, Inc, TSLA has closed above its 20 period moving average.
Short term, 20 moving average is currently below mid-term 50 MA,and below long term 100 moving average.
Observe carefully, the 20 MA is very close to 50 MA, therefore it is likely 20 MA may be crossing 50 MA.
Manage your risk.
June 1, 2018 Tesla Inc and MA and BB
Moses
AmiBrokerAcademy.com
Disclaimer
The above result is for illustration purpose. It is not meant to be used for buy or sell decision. We do not recommend any particular stocks. If particular stocks of such are mentioned, they are meant as demonstration of Amibroker as a powerful charting software and MACD. Amibroker can program to scan the stocks for buy and sell signals.
These are script generated signals. Not all scan results are shown here. The MACD signal should use with price action. Users must understand what MACD and price action are all about before using them. If necessary you should attend a course to learn more on Technical Analysis (TA) and Moving Average Convergence Divergence, MACD.
Once again, the website does not guarantee any results or investment return based on the information and instruction you have read here. It should be used as learning aids only and if you decide to trade real money, all trading decision should be your own.