May 4, 2019
Welcome!
Welcome to AmiBrokerAcademy.com. Thanks for visiting the site.
Although we told you we interpreting the markets emotion, price action using patterns and indicators different from other. Hope this make sense to you. This method are not invented by us, the only thing make the interpretation different this is from our understanding.
Have fun!
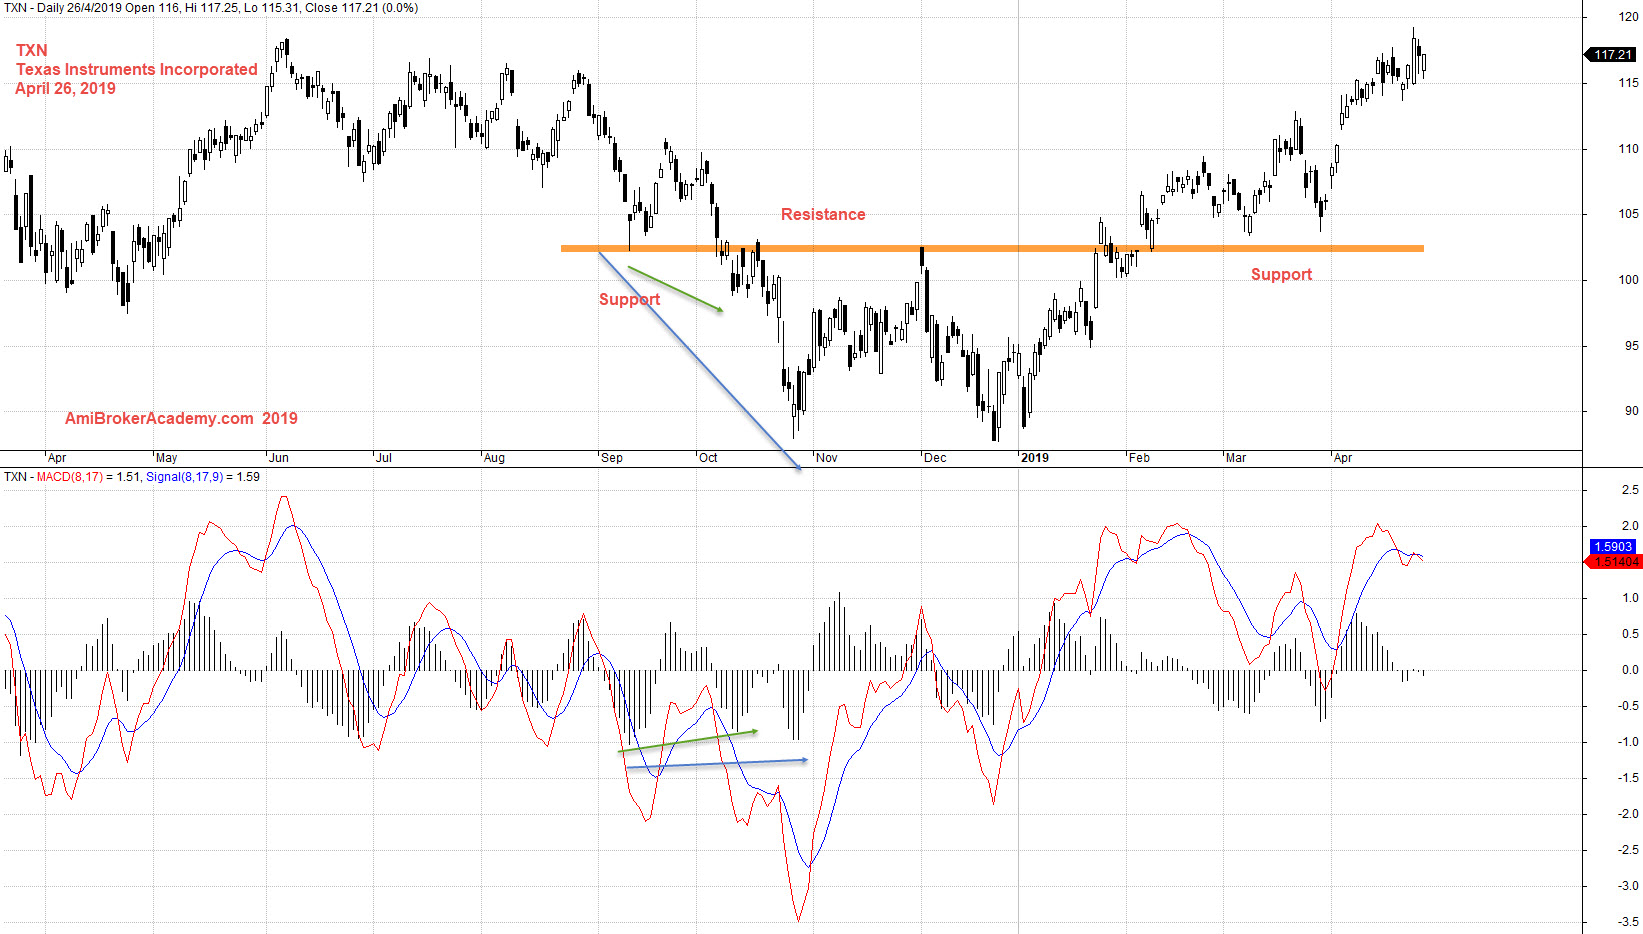
TXN Texas Instruments Incorporated Stock Charting
Study Texas Instruments Incorporated stock chart and River.
See chart, picture worth a thousand words.
Zoom in and see price action from top to bottom. Price action retest the support before pullback and retest the high. In this chart, we see the retest is similar to the same high in last July. Can the price action continue to move higher? May be. But, from MACD the strength is at a high, very high.
Trade with your eyes open.
Moses Stock Observation
AmiBrokerAcademy.com
Disclaimer
The above result is for illustration purpose. It is not meant to be used for buy or sell decision. We do not recommend any particular stocks. If particular stocks of such are mentioned, they are meant as demonstration of Amibroker as a powerful charting software and MACD. Amibroker can program to scan the stocks for buy and sell signals.
These are script generated signals. Not all scan results are shown here. The MACD signal should use with price action. Users must understand what MACD and price action are all about before using them. If necessary you should attend a course to learn more on Technical Analysis (TA) and Moving Average Convergence Divergence, MACD.
Once again, the website does not guarantee any results or investment return based on the information and instruction you have read here. It should be used as learning aids only and if you decide to trade real money, all trading decision should be your own.