21 September 2020
Welcome to AmiBroker Academy, Moses Stock Charting. Thanks for visiting the site.
We started the site way back in 2009 to promote AmiBroker charting tool. But we are but AmiBroker, for any question regarding the charting software please contact them at amibroker.com.
Trade with eyes open. Manage your risk. Have fun!
TSM | Taiwan Semiconductor Manufacturing Company Stock Charting
Study Taiwan Semiconductor Manufacturing Company aka TSMC Stock Charting and Price Action.
Picture worth a thousand words. See chart.
Trade with eyes open. Mange your risk.
We use indicator, but we read chart on their price action. Don’t miss taken.
Price Action
Price Action moves in zigzag manner.
Support Resistance or Trendline
Buy Support Sell Resistance.
Box
Box the month high low to understand the key level.
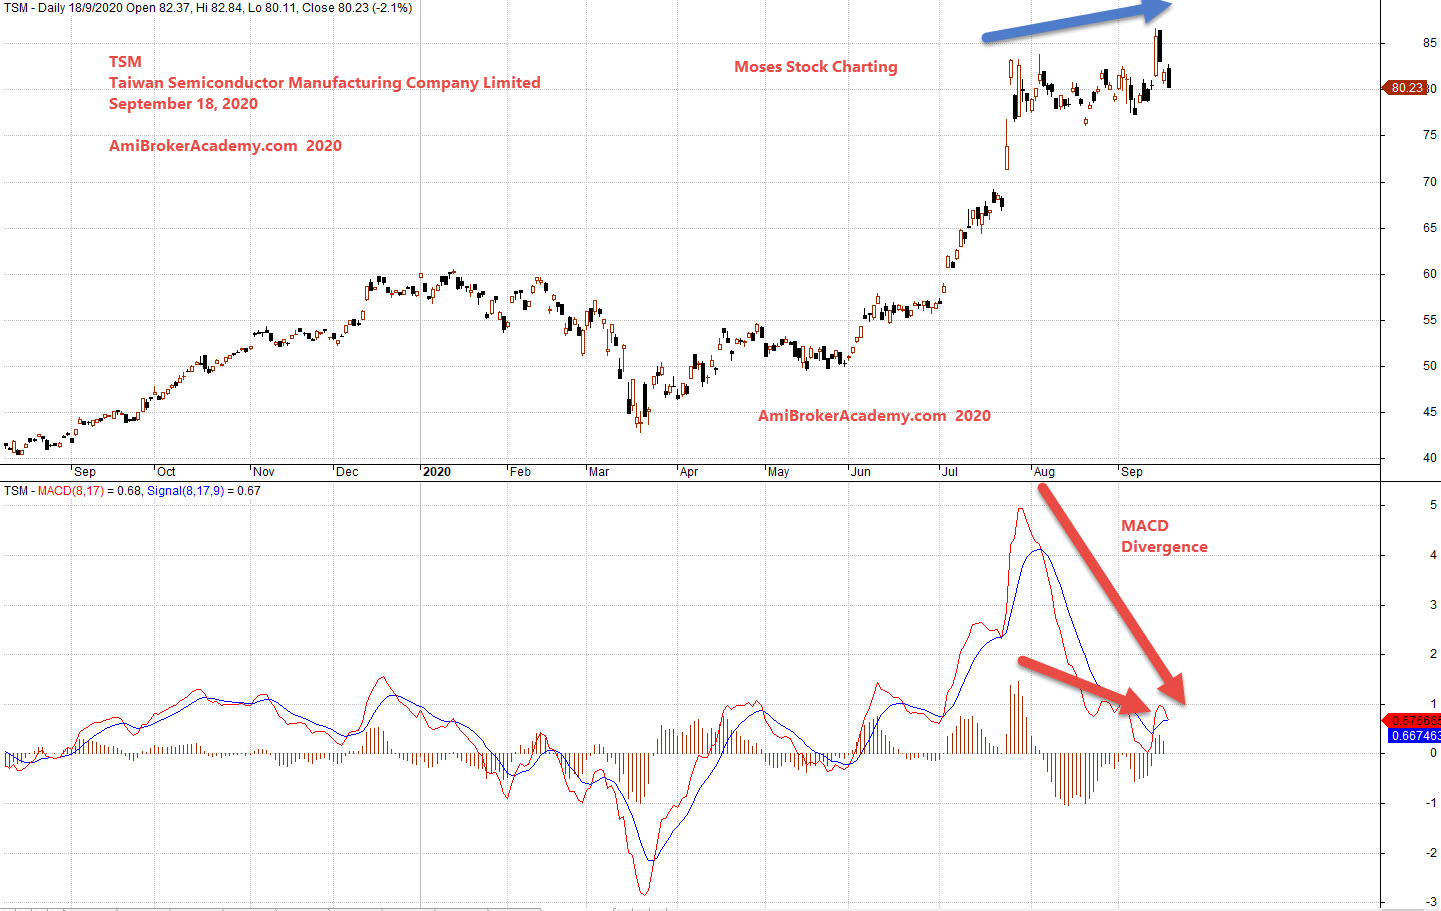
MACD
The MACD is an oscillator indicator. It is a momentum indicator that is widely used to identify divergence for potential trend reversals.
The bull or bear trend may continue just like you do not stop at each traffice light.
What ever trading strategy you use, you always must wait for price action confirmation. Trade with eyes open. Manage your risk.
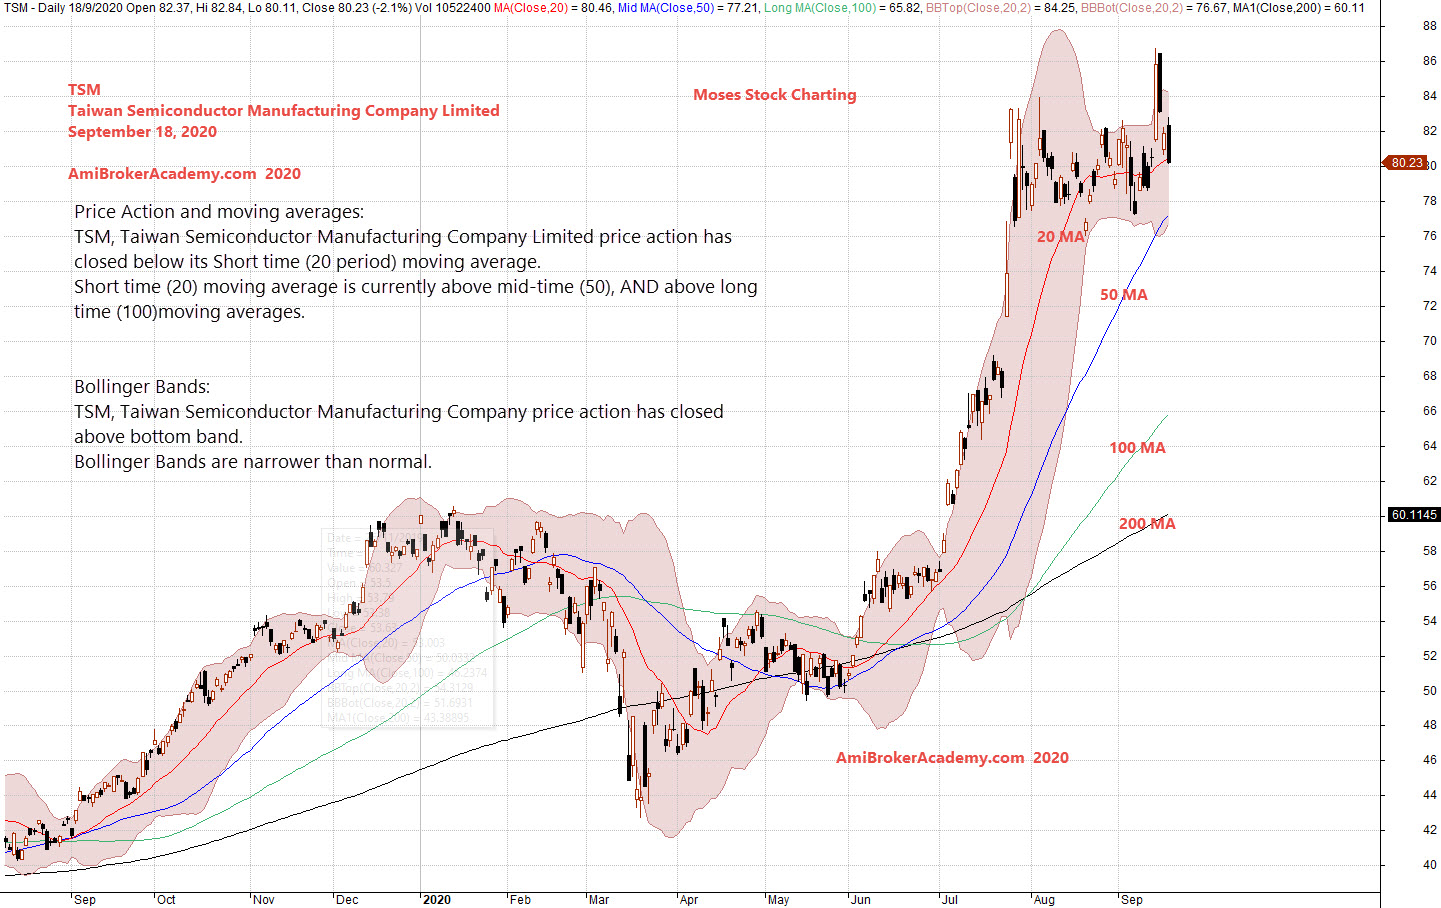
Bollinger Bands
Price Action are contained within the band. When band goes wider, mean price action or market emotion is more volatile and compare to s narrow band. Trade with eyes open.
Moses Stock Observation
AmiBrokerAcademy.com
Disclaimer
The above result is for illustration purpose. It is not meant to be used for buy or sell decision. We do not recommend any particular stocks. If particular stocks of such are mentioned, they are meant as demonstration of Amibroker as a powerful charting software and MACD. Amibroker can program to scan the stocks for buy and sell signals.
These are script generated signals. Not all scan results are shown here. The MACD signal should use with price action. Users must understand what MACD and price action are all about before using them. If necessary you should attend a course to learn more on Technical Analysis (TA) and Moving Average Convergence Divergence, MACD.
Once again, the website does not guarantee any results or investment return based on the information and instruction you have read here. It should be used as learning aids only and if you decide to trade real money, all trading decision should be your own.