July 8, 2017
Six Months Stock Performance
We have just completed half year mark of 2017, let’s look back to see what is the share price and plan for the next six months. Have fun!
TSLA Tesla Inc and First Half of 2017 Share Price Performance
Picture worth a thousand words.
We see the share price fail to breakout in the second half of 2016 and goes sideways till beginning of 2017. The share price finally bounced up and break the 2016 second half high. The price retest a resistance and continue the trend. The share price trend is still up, very bullish.
The buyers willing to pay for the high price due to the market think the price is still cheap. The price will start to fail, when the market does agree on the high price anymore. Watch your trade and have fun!
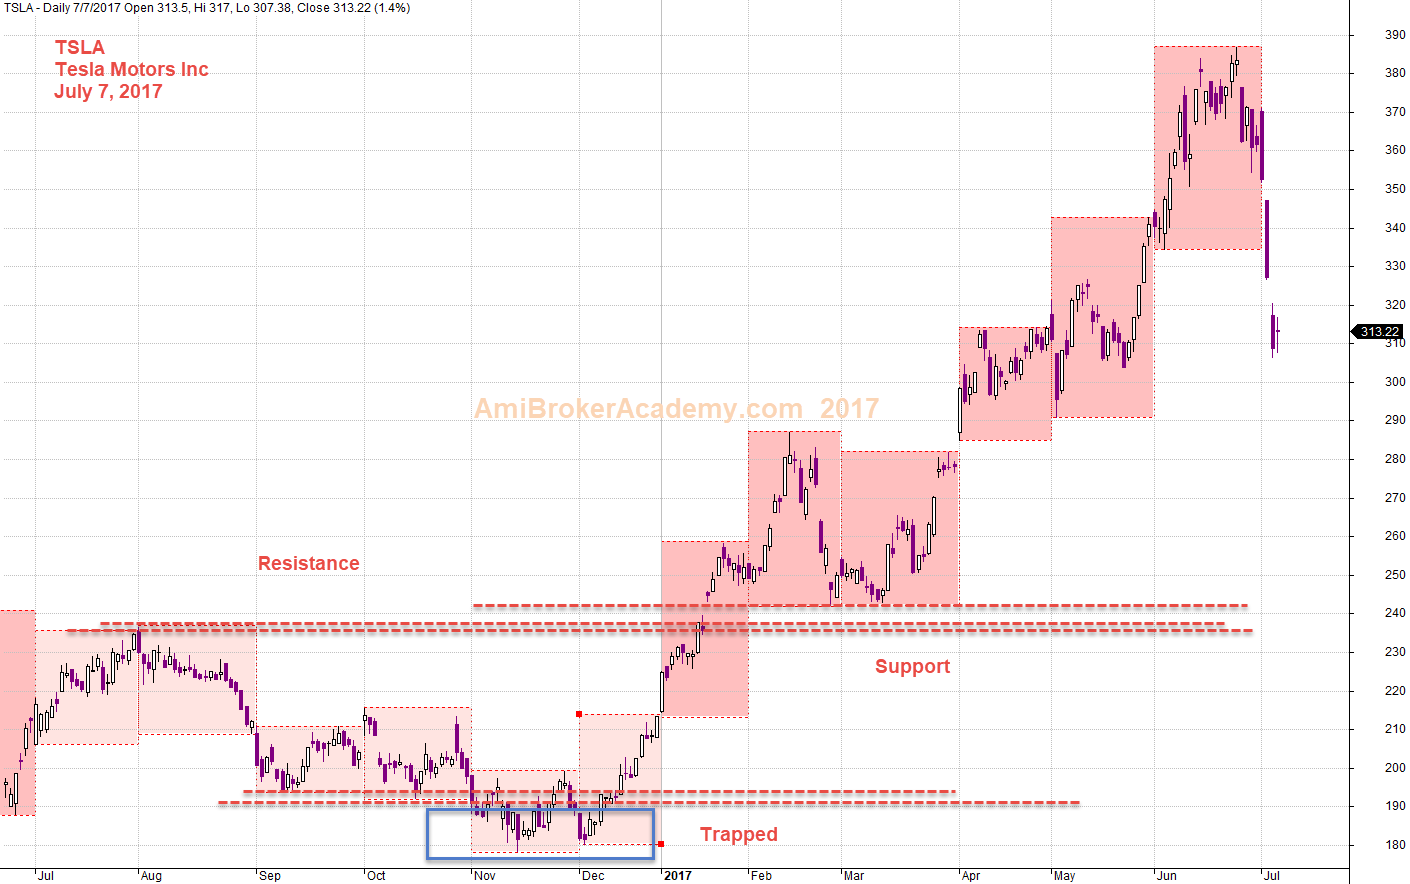
July 7, 2017 Tesla Motor Inc and Major Support Resistance
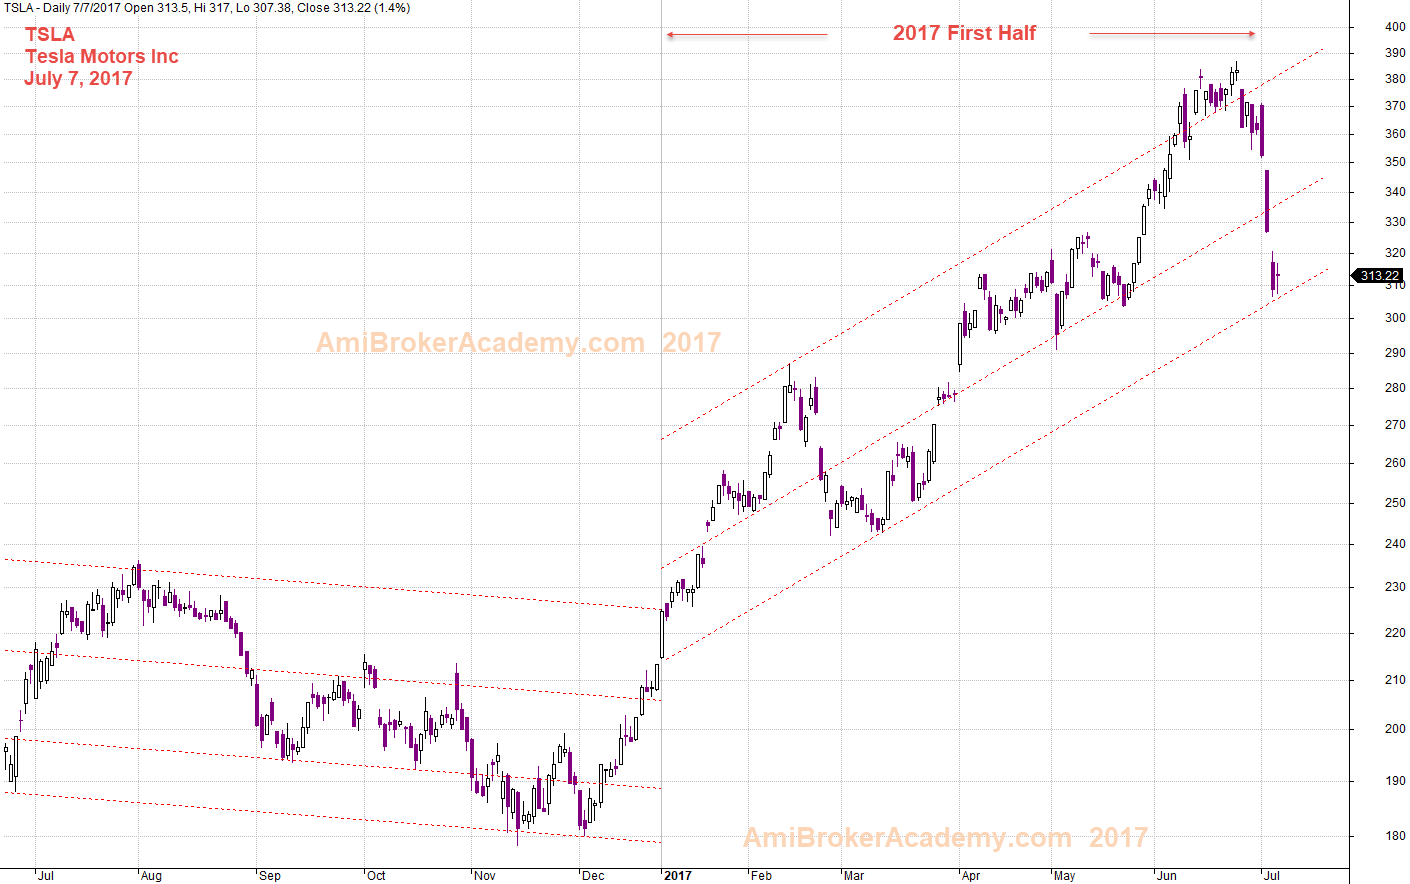
Tesla Inc and Six Months Channel
Connect the high or low draw a trendline, after copy the trendline and past on the other side. In other words, if copy the connection of low, then paste on the high.
Channel is a great visual tool too. The price moves from bottom left to top right. Bullish trend.
And if you will break the channel into two parts, two equal parts. In this case, six months, you see a different picture. What’s is your feeling and understand? Enjoy your trading journey. Have fun!
July 7, 2017 Tesla Motor Inc and Six Months Channels
TSLA and MACD Signals
If you are here often enough, you know what we are looking out for in MACD signals, cross up, cross down, divergence, cross zeroline. Enjoy learning.
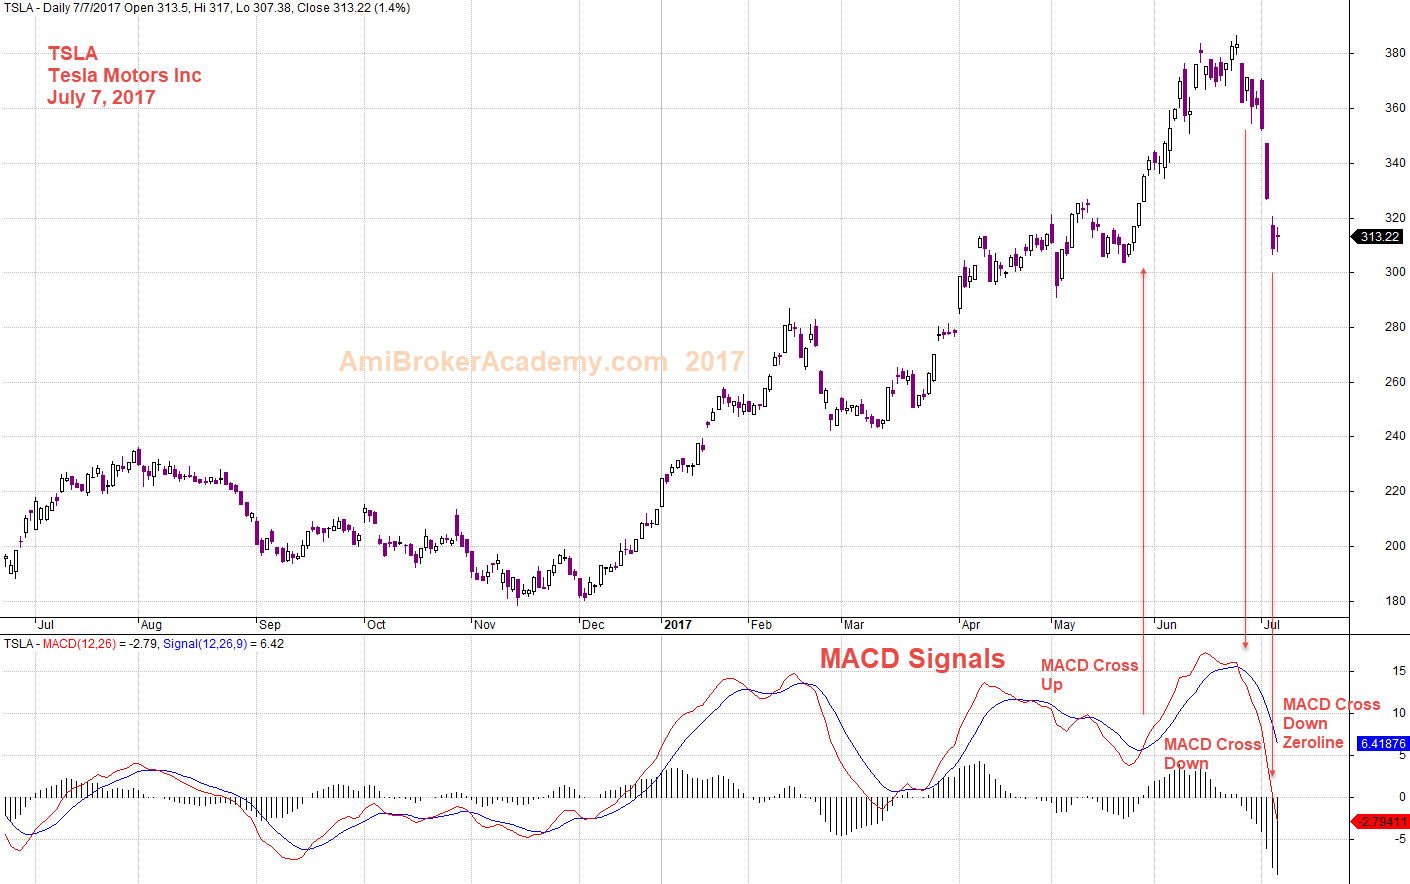
July 7, 2017 Tesla Motor Inc and Key MACD Signals
TSLA and Channel
The channel is too wide, let’s breakout to smaller one. You see layers of the price action. Have fun learning!
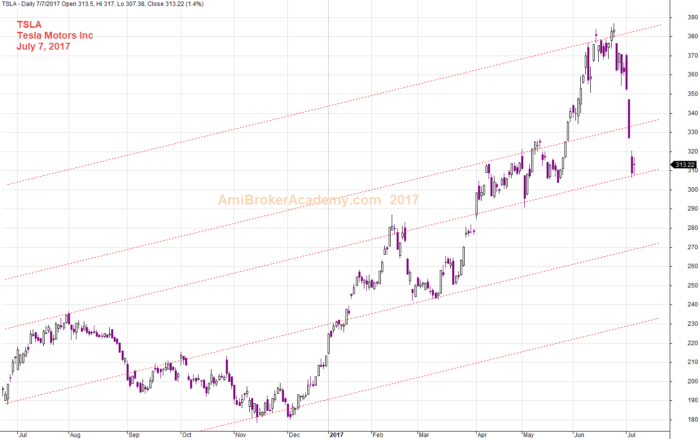
July 7, 2017 Tesla Motor Inc and Channel
Who’s Tesla?
Tesla Inc. is an American automaker, energy storage company, and solar panel manufacturer based in Palo Alto, California.
The current CEO is Elon Musk. He is in position since 2008. The company was founded in 2003. It has seven billion dollars revenue as 2016.
Risk
If you can wait, remember professional likes to wait for retracement. This will minimize the risk, as your stop loss will be smaller. So, picture worth a thousand words. In this case study, if you wait for pullback, you will have a handson gain; you can enjoy a big move in short time. Waw!
Professional Try Not to Buy and Sell Higher!
Professional trade on retracement.
What if you thought you miss and you jump in. You may be ended up you can not sleep for a days. … As you might be buy high and expecting to sell higher.
Moses
AmiBrokerAcademy.com
Disclaimer
The above result is for illustration purpose. It is not meant to be used for buy or sell decision. We do not recommend any particular stocks. If particular stocks of such are mentioned, they are meant as demonstration of Amibroker as a powerful charting software and MACD. Amibroker can program to scan the stocks for buy and sell signals.
These are script generated signals. Not all scan results are shown here. The MACD signal should use with price action. Users must understand what MACD and price action are all about before using them. If necessary you should attend a course to learn more on Technical Analysis (TA) and Moving Average Convergence Divergence, MACD.
Once again, the website does not guarantee any results or investment return based on the information and instruction you have read here. It should be used as learning aids only and if you decide to trade real money, all trading decision should be your own.