12 April, 2018
Trapped
Many of the traders rush to buy stock when they thought they have missed big time, on the contrary they do not missed much if they continue to miss. Those whom missed and buy get trapped. See the example below, the price action after the peak forms a bearish ABCD pattern. the upflow got trapped, the AB leg got trapped, the BC leg got trapped. Manage your risk.
US Stock Chart Analysis
Alpine Total Dynamic Dividend Fund Charting
Picture worth a thousand words, see chart on Alpine Total Dynamic Dividend Fund using channel and support resistance. Can you see price action trapped? Only until the price action goes above those price, otherwise it is considered trapped. Price action has now gone below the resistance, you can see the
Manage your risk!
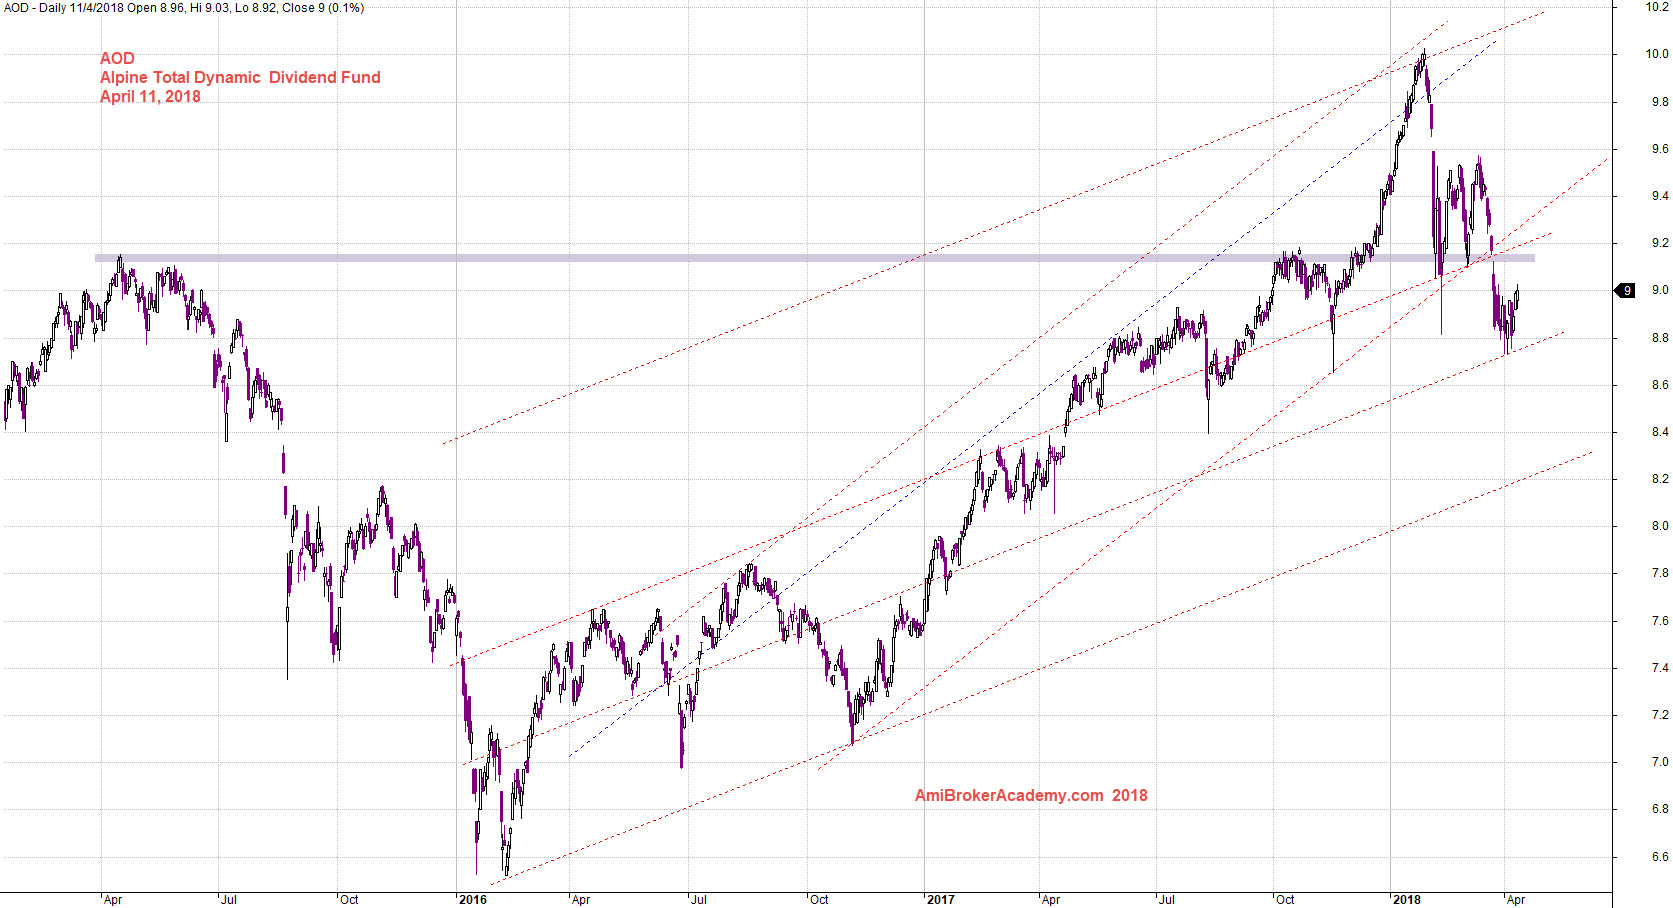
April 11, 2018 Alpine Total Dynamic Dividend Fund Charting
Moses US Stock Chart Analysis
AmiBrokerAcademy.com
Disclaimer
The above result is for illustration purpose. It is not meant to be used for buy or sell decision. We do not recommend any particular stocks. If particular stocks of such are mentioned, they are meant as demonstration of Amibroker as a powerful charting software and MACD. Amibroker can program to scan the stocks for buy and sell signals.
These are script generated signals. Not all scan results are shown here. The MACD signal should use with price action. Users must understand what MACD and price action are all about before using them. If necessary you should attend a course to learn more on Technical Analysis (TA) and Moving Average Convergence Divergence, MACD.
Once again, the website does not guarantee any results or investment return based on the information and instruction you have read here. It should be used as learning aids only and if you decide to trade real money, all trading decision should be your own.