June 16, 2019
Welcome to AmiBrokerAcademy.com. Thanks for visiting the site.
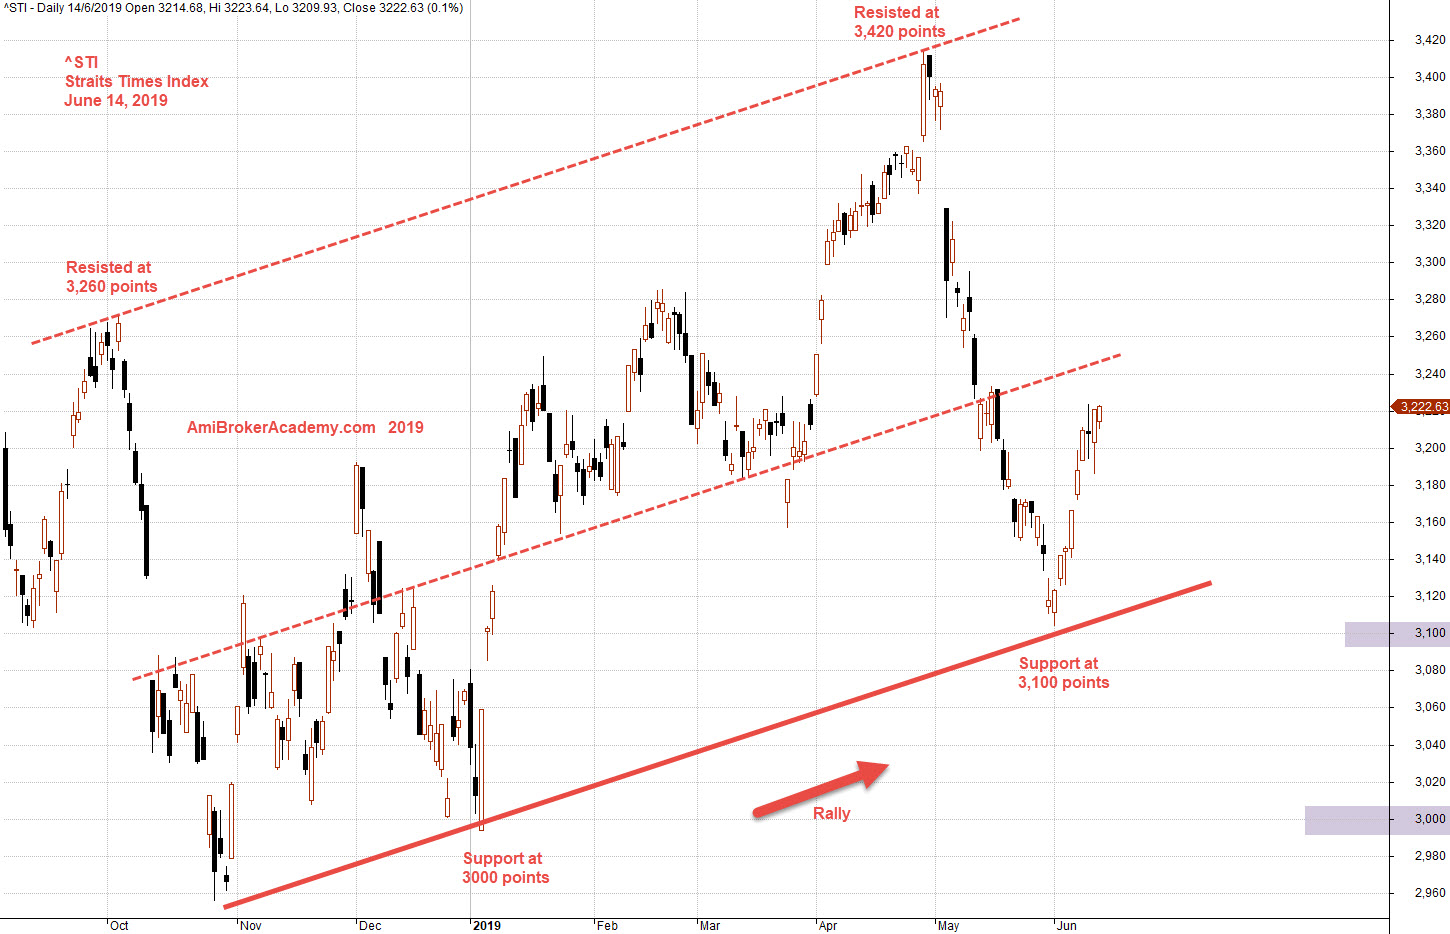
^STI ST Index Straits Times Index Stock Charting
Study Straits Times Index, ST Index and Channel.
See chart, picture worth a thousand words.
Connect the two lows and draw a trend line, copy and paste the trendline to a top. Wait and see.
When the price action is bullish? You could project the price action will touch the paste trendline in some point of time.
Take profit when the price action touch the upper trend line.
Next, wait for the price action to pullback to hit the lower bound trendline. Ready to buy again when the price action get supported by the lower trendline.
Sound easy. But can you do it? Will see.
Trade with your eyes open.
Moses Stock Observation
AmiBrokerAcademy.com
Disclaimer
The above result is for illustration purpose. It is not meant to be used for buy or sell decision. We do not recommend any particular stocks. If particular stocks of such are mentioned, they are meant as demonstration of Amibroker as a powerful charting software and MACD. Amibroker can program to scan the stocks for buy and sell signals.
These are script generated signals. Not all scan results are shown here. The MACD signal should use with price action. Users must understand what MACD and price action are all about before using them. If necessary you should attend a course to learn more on Technical Analysis (TA) and Moving Average Convergence Divergence, MACD.
Once again, the website does not guarantee any results or investment return based on the information and instruction you have read here. It should be used as learning aids only and if you decide to trade real money, all trading decision should be your own.