October 23, 2017
Gartley Pattern
- Why trade with Gartley pattern, as it is an easy way to identify trading opportunities in any market, on any time frame, and in any market condition.
- A leading indicator to identify entery and exit
Larry Pesavento and Gartley Pattern
- Gartley Pattern is a visual, geometric price or time pattern comprised of four consecutive price swings, or trends—it looks like a skewed “W” or “M” on price chart
- On the other hand, you can visual as ABCD pattern preceded by a swing high or swing low
- Gartley ABCD pattern was first introduced in 1935 by trader H.M. Gartley in his book, Profits in the Stock Market. Subsequently, the specific pattern characteristics including Fibonacci price or time ratios applied by veteran trader Larry Pesavento in his book, Fibonacci Ratios with Pattern Recognition.
Example
Let use 10 Year T-Note as an example to illustrate the Gartley ABCD Pattern. Enjoy the learning. Have fun!
^TNX 10 Year T-Note and Gartley ABCD Pattern
Picture worth a thousand words, see chart for more. We can easily spot many many ABCD pattern. of course some did not result in AB = CD, but still can see the ABCD M or W pattern, right? Remember, all set up can fail. In the case here just for 2017 along, you can see many.
See 34 MA Band, and Channel too on the chart. These indicators also give you a different perspective on the price action.
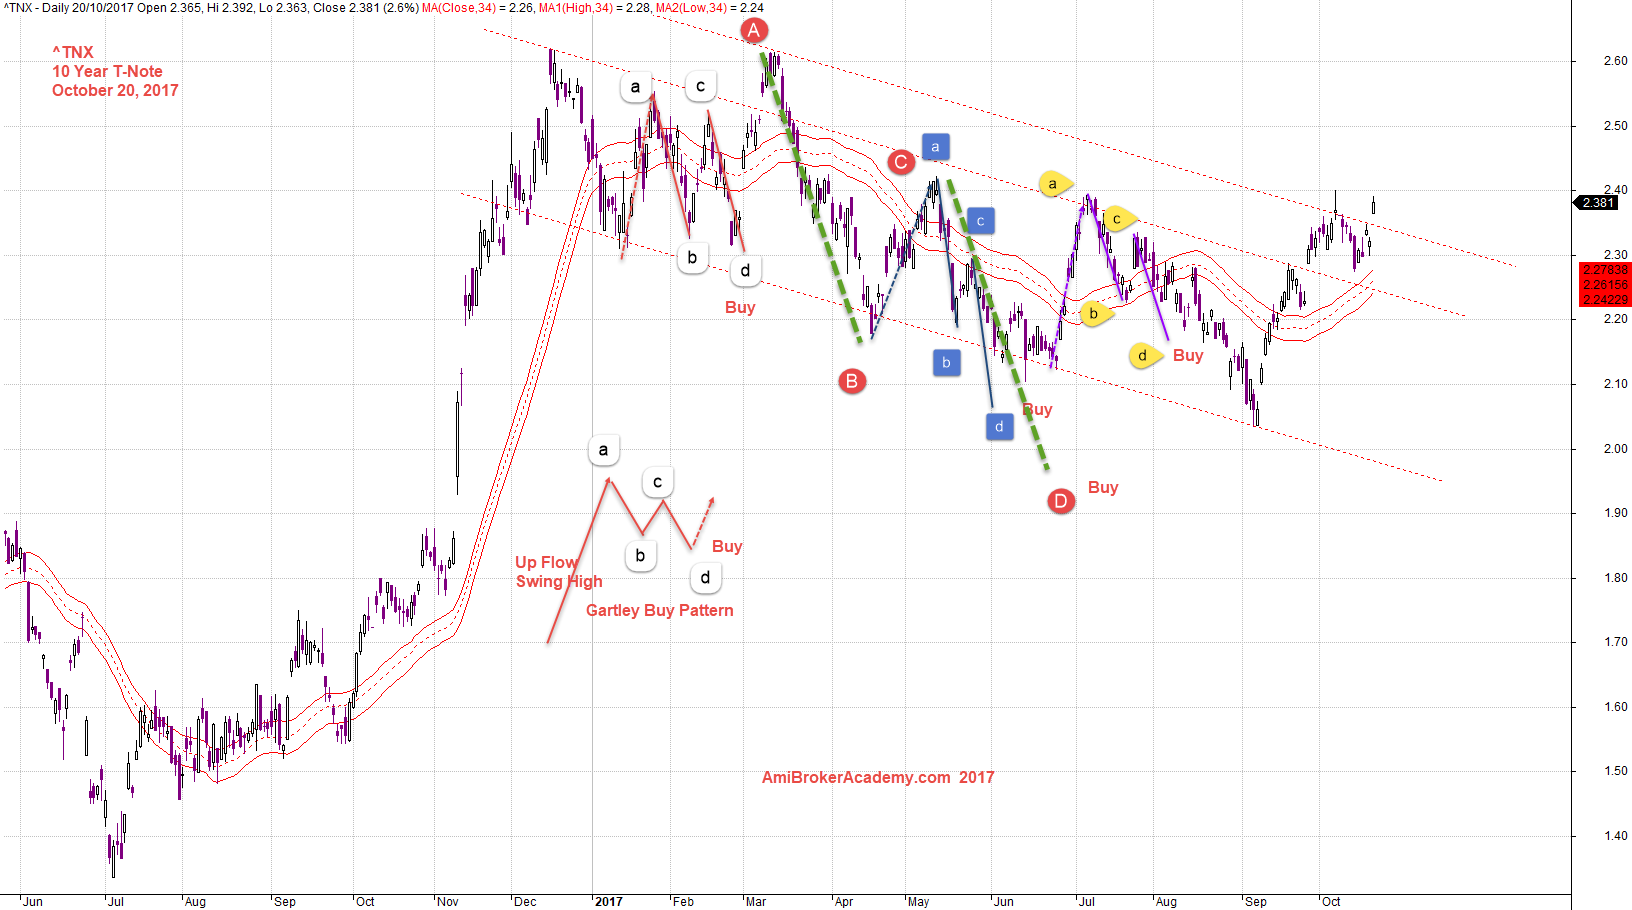
October 20, 2017 10 Year T-Note and Gartley ABCD pattern
Thanks for visit the site, AmiBrokerAcademy.com. Hope you enjoy the writing here. Have fun!
Moses
AmiBrokerAcademy.com
Read:
Disclaimer
The above result is for illustration purpose. It is not meant to be used for buy or sell decision. We do not recommend any particular stocks. If particular stocks of such are mentioned, they are meant as demonstration of Amibroker as a powerful charting software and MACD. Amibroker can program to scan the stocks for buy and sell signals.
These are script generated signals. Not all scan results are shown here. The MACD signal should use with price action. Users must understand what MACD and price action are all about before using them. If necessary you should attend a course to learn more on Technical Analysis (TA) and Moving Average Convergence Divergence, MACD.
Once again, the website does not guarantee any results or investment return based on the information and instruction you have read here. It should be used as learning aids only and if you decide to trade real money, all trading decision should be your own.