25 August, 2018
Singapore Stock Stories
Thanks for visiting the site.
Time to Buy – D05 DBS Group Holdings Charting
If your trading strategy is buy support and sell resistance. See chart, is the price action at the support. Study DBS Group Holdings stock price. We see the price action retest the 25 again. Look left, you see the price action is testing the 2018 first quarter low. Trade with your eyes open.
What will the the price action like for the next few days or weeks or maybe months? Will the stock price move north from now on? Monitor the stock price. .
Manage your risk.
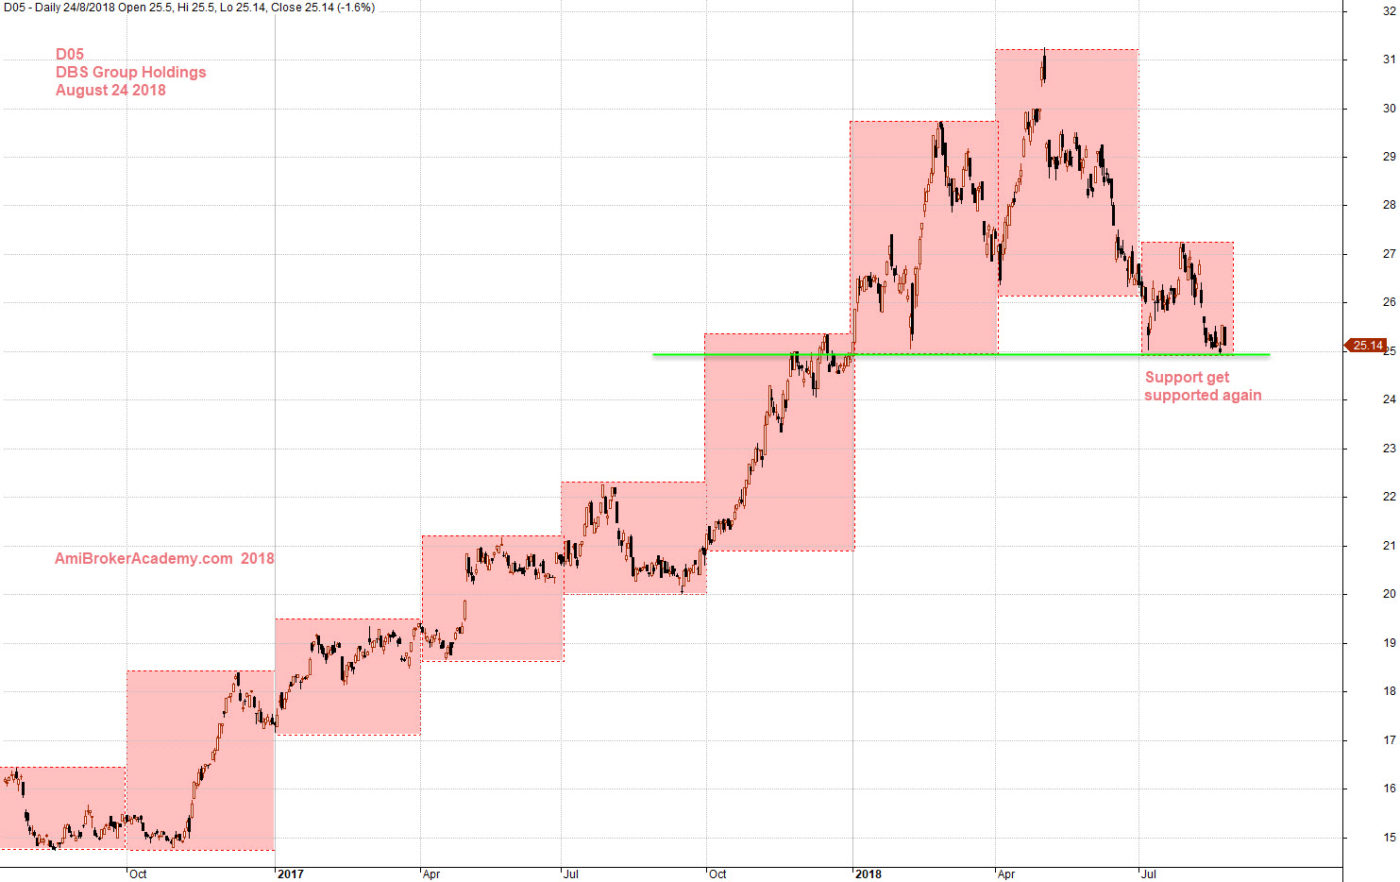
August 24, 2018 DBS Group Holdings and Support
D05 DBS Group Holdings and ABCD Patterns
See chart for more, we found a bullish ABCD pattern, and a bearish ABCD pattern. Bullish ABCD pattern was completed in full that follow a sell, but the bearish ABCD pattern seems to be in progress. Trade with eyes open. Manage your risk.
When in a bull market, everyone seems to be smart. As anything you buy, you win or anytime you buy you win too. But when the trend is sometime up some down, no one seems to be as smart this time. So, are you smart to trade this round? Will see.
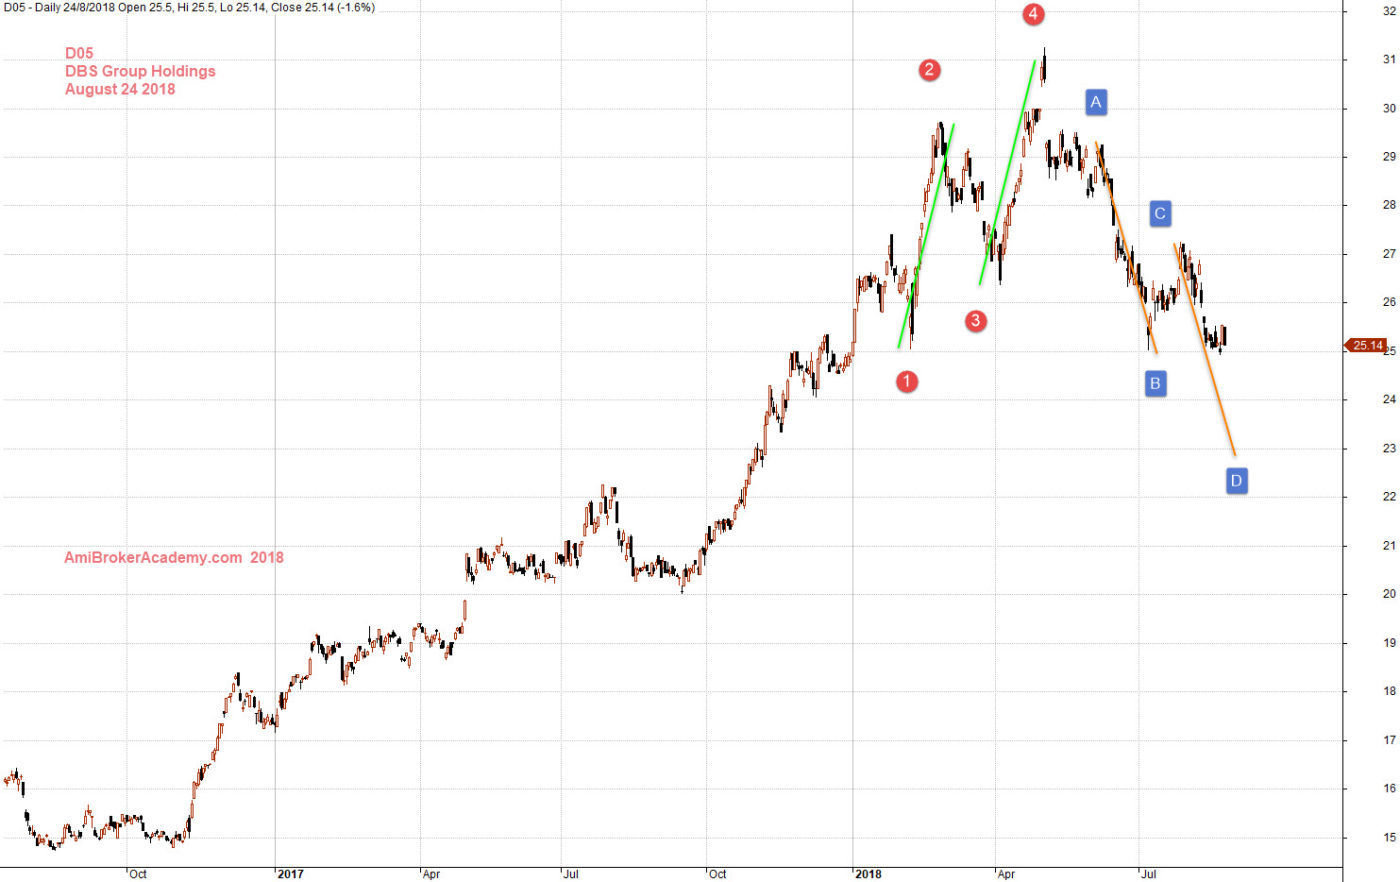
August 24, 2018 DBS Group Holdings and ABCD Pattern
D05 DBS Group Holdings and MACD
See chart, picture worth a thousand words. Divergence, a bullish divergence. Will see.
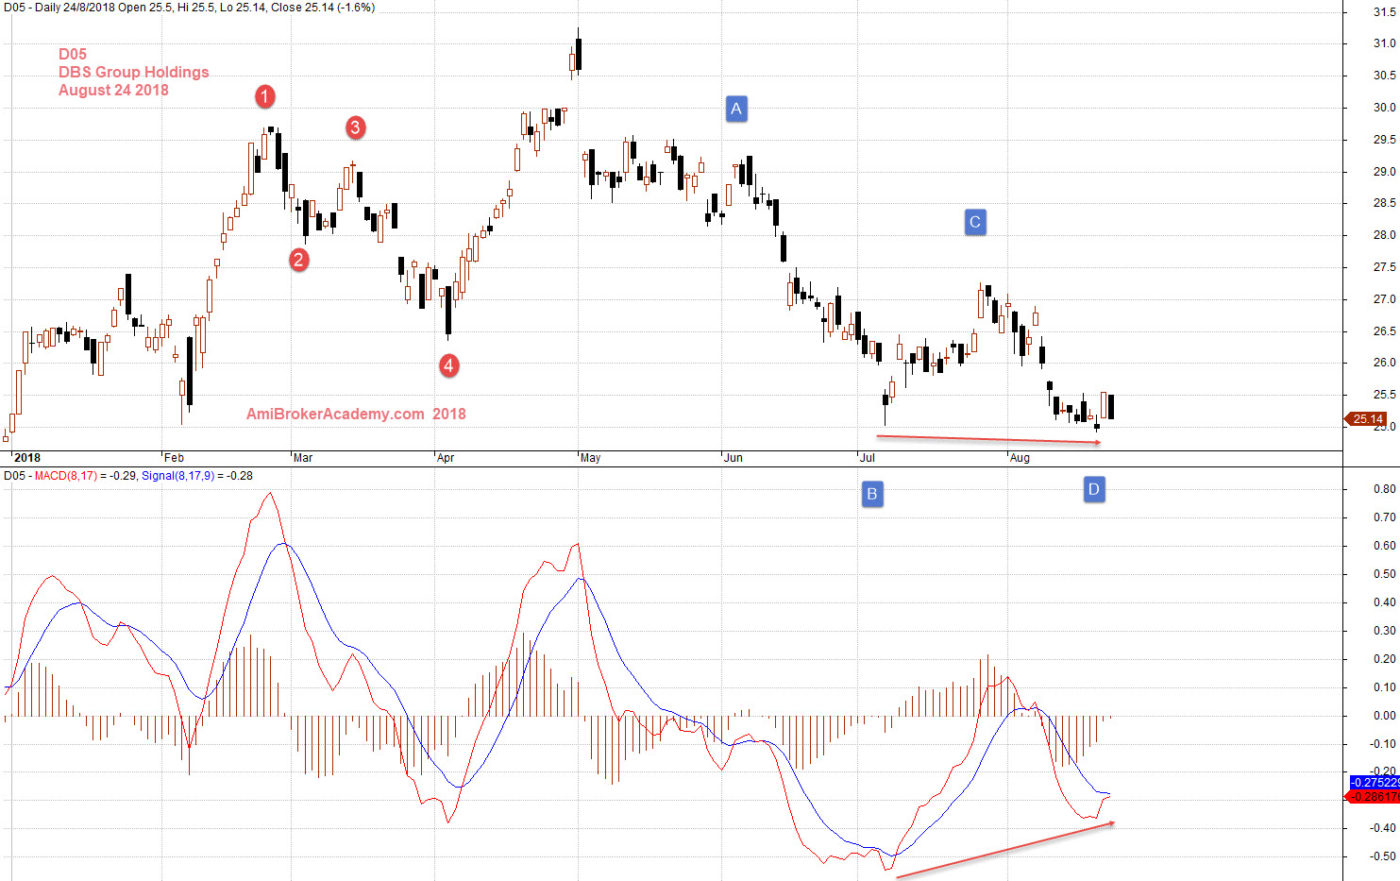
August 24, 2018 DBS Group Holdings and MACD
Moses
AmiBrokerAcademy.com
Disclaimer
The above result is for illustration purpose. It is not meant to be used for buy or sell decision. We do not recommend any particular stocks. If particular stocks of such are mentioned, they are meant as demonstration of Amibroker as a powerful charting software and MACD. Amibroker can program to scan the stocks for buy and sell signals.
These are script generated signals. Not all scan results are shown here. The MACD signal should use with price action. Users must understand what MACD and price action are all about before using them. If necessary you should attend a course to learn more on Technical Analysis (TA) and Moving Average Convergence Divergence, MACD.
Once again, the website does not guarantee any results or investment return based on the information and instruction you have read here. It should be used as learning aids only and if you decide to trade real money, all trading decision should be your own.