March 31, 2018
US Stock Chart Analysis
TSLA Tesla Inc and Fibonacci
Study Tesla Inc stock price using Fibonacci, swing low to high. We see stock price was supported by 61.8% a few times. Finally the stock price breakout below 61.8%. The stock price may breakout below the low, the swing low.
Tesla Inc stock price was so bullish approaching 390, but after retest the same high again. The market seems to let go the stock and the stock price struggle and after supported around 300 for a few times. The stock price just breakout below. The market seems to feel 240 may be is the right price for now.
Powerful Chart Software – AmiBroker
The following chart is produced using AmiBroker charting software. It is a powerful chart software. Anything, finance ticket you could download from Yahoo! Finance you could plot them, those you are interested all in a chart, so you could analyse them.
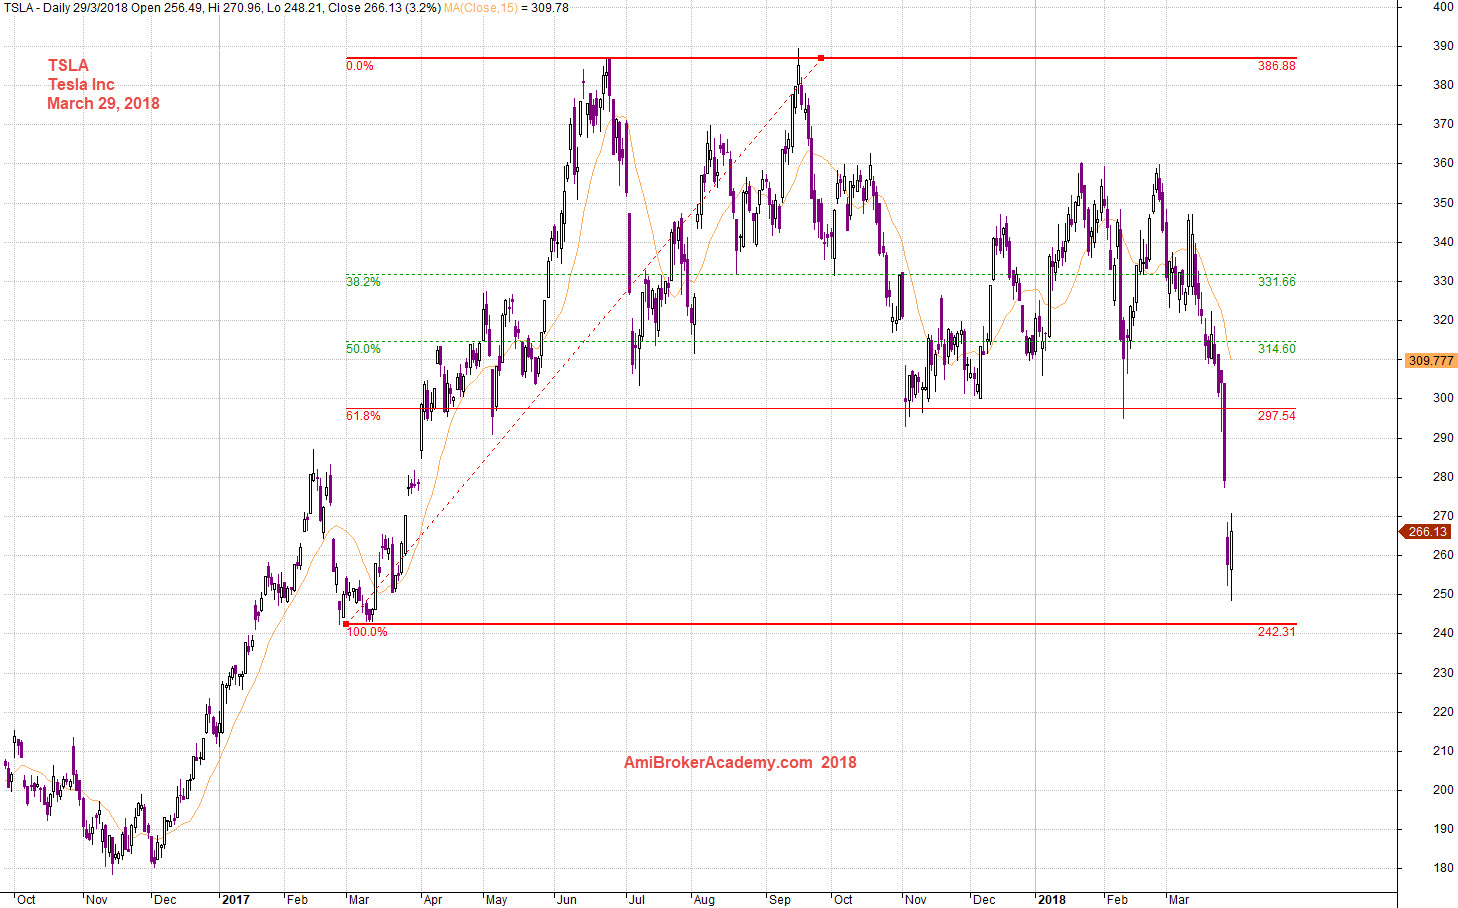
March 29, 2018 Tesla Inc and Fibo Retracement Swing Low to High
Moses Stock Chart Analysis
AmiBrokerAcademy.com
Disclaimer
The above result is for illustration purpose. It is not meant to be used for buy or sell decision. We do not recommend any particular stocks. If particular stocks of such are mentioned, they are meant as demonstration of Amibroker as a powerful charting software and MACD. Amibroker can program to scan the stocks for buy and sell signals.
These are script generated signals. Not all scan results are shown here. The MACD signal should use with price action. Users must understand what MACD and price action are all about before using them. If necessary you should attend a course to learn more on Technical Analysis (TA) and Moving Average Convergence Divergence, MACD.
Once again, the website does not guarantee any results or investment return based on the information and instruction you have read here. It should be used as learning aids only and if you decide to trade real money, all trading decision should be your own.