July 16, 2017
The Market
Today markets (referring to financial market) react to economic news, or news in a fraction of a second, with computer algorithms driving most of the trade. Many of the market or many countries are heavily influenced by the US Indexes such as Dow, S&P 100 and so on.
Heavily traded stocks, indexes rise and fall for reasons that are nearly impossible to understand at the individual level.
Those Days Have Passed
There was a time, when individual investors were the dominant force in the market (and very few computers). When buying a stock was equivalent to betting on the behaviour of the other market participants. Those days have passed.
Balanced the Problem
Traders who recognize these dynamics can gain some advantage as they have to balanced and have a realistic view of the problem. These traders will spend time identifying the underlying forces and the markets, and try to ride the waves with these forces instead of against them. In understand this, these traders tend to be humble as successful in trading or some are investing is never ending a hard work and struggle.
Hard Work and Struggle
Trading is not an easy task, never an easy task. It is hard work and struggle to identifying the forces and the markets intend so you can ride the waves with the big players.
^NYA NYSE Composite Index and Keys Support Resistance
Picture worth a thousand words. See chart for more information.
Many of the market or many countries are heavily influenced by the US Indexes such as Dow, S&P 100 and so on.
What a pullback recently (in July) has cause the world spinning! A three months resistance has defended the fall, drive the index north again. Watch out.
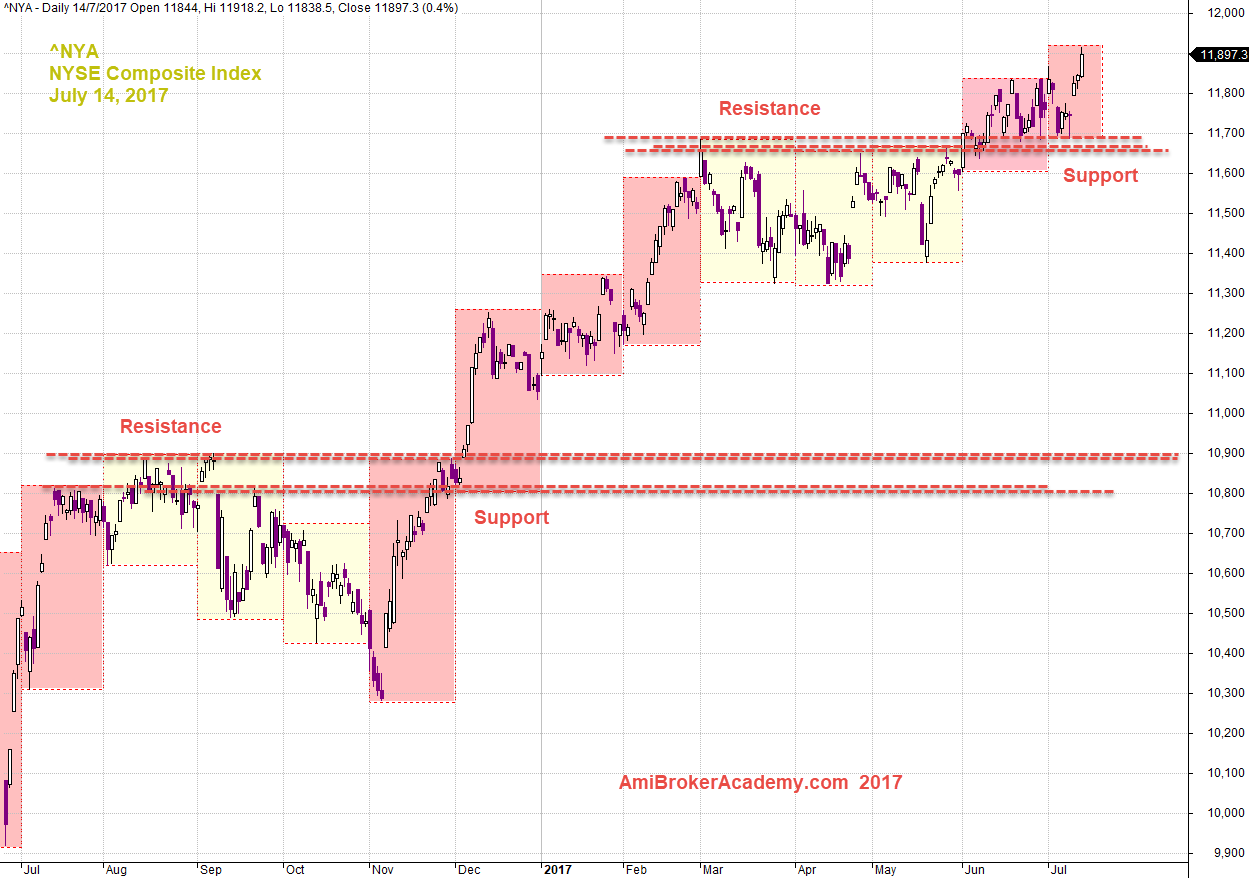
July 14, 2017 NYSE Composite Index and Support Resistance
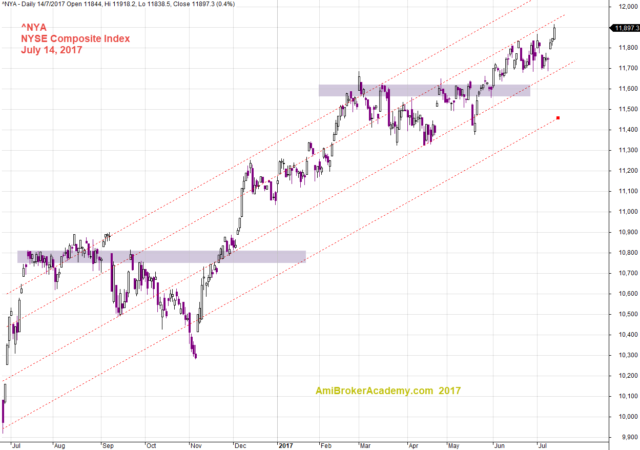
^NYA and Channel
Picture worth a thousand words. See chart for more on channel.
Channel is a special support resistance, instead of using horizontal line. Channel uses the trendline. Connect any two low to draw a trendline, copy and past the trendline to the top of the price action. These form a channel.
The price action stop to falling further after meet the support trendline, lower band of channel. The price action stop to move further north after resisted by the upper trendline, or upper band of channel.
Again, channel is like trendline, some analyst may not draw the channel as you. See the chart that follows for what we mean.
July 14, 2017 NYSE Composite and Channel
NYSE Composite Index and Channel
See chart for more, the following channel is slightly different from the one above.
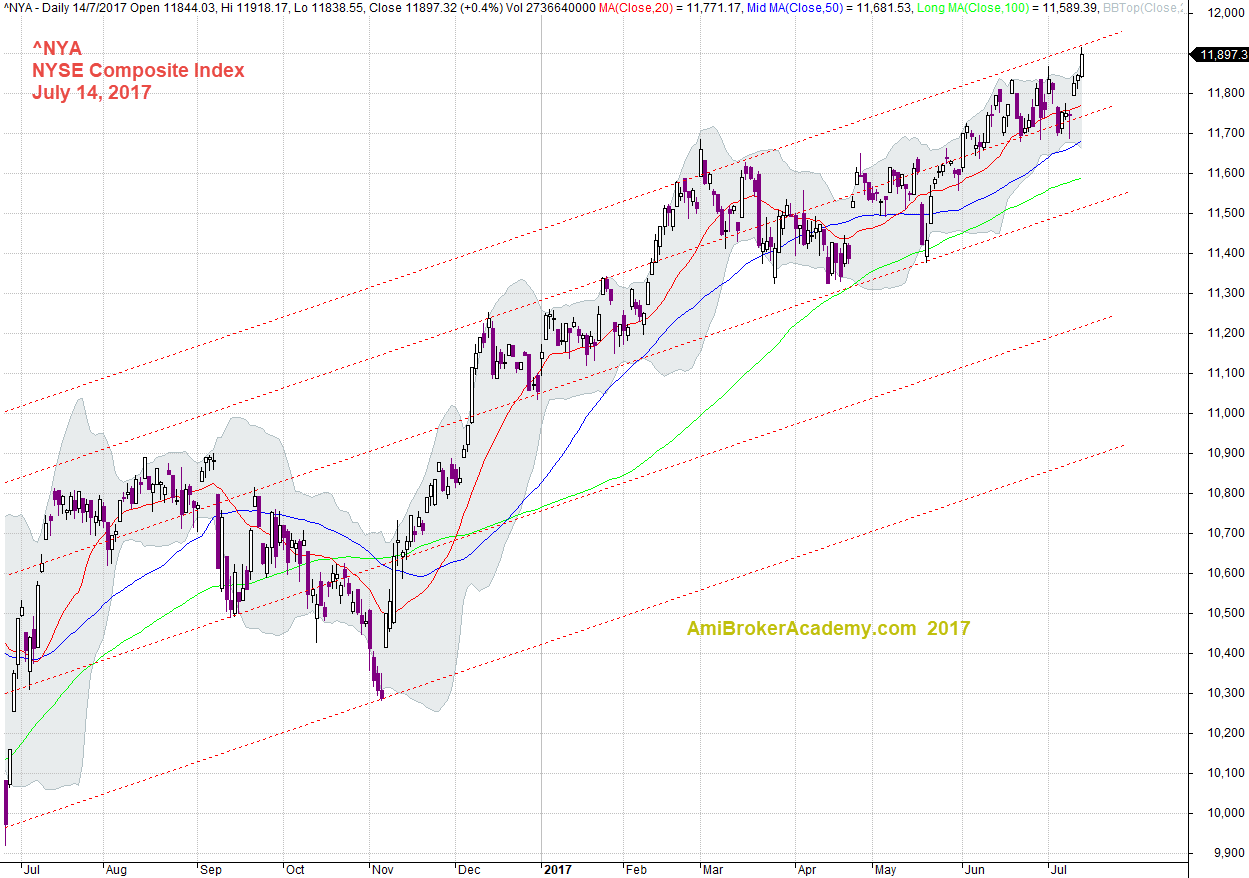
July 14, 2017 NYSE Composite and Channel and Bollinger Bands
Moses
AmiBrokerAcademy.com
Disclaimer
The above result is for illustration purpose. It is not meant to be used for buy or sell decision. We do not recommend any particular stocks. If particular stocks of such are mentioned, they are meant as demonstration of Amibroker as a powerful charting software and MACD. Amibroker can program to scan the stocks for buy and sell signals.
These are script generated signals. Not all scan results are shown here. The MACD signal should use with price action. Users must understand what MACD and price action are all about before using them. If necessary you should attend a course to learn more on Technical Analysis (TA) and Moving Average Convergence Divergence, MACD.
Once again, the website does not guarantee any results or investment return based on the information and instruction you have read here. It should be used as learning aids only and if you decide to trade real money, all trading decision should be your own.