12 April, 2018
US Stock Chart Analysis
^DJI Dow Jones Industrial Average and NASDAQ Composite Index Correlation
Picture worth a thousand words, see chart think think got more things. Compare the two key indexes of US Stock markets, we see some interesting things. The traders seem do not agree on some expect, but ultimately still bearish, or fear, quick to jump off ship – sell off and turns paper into cash. Got it?
Manage your risk!
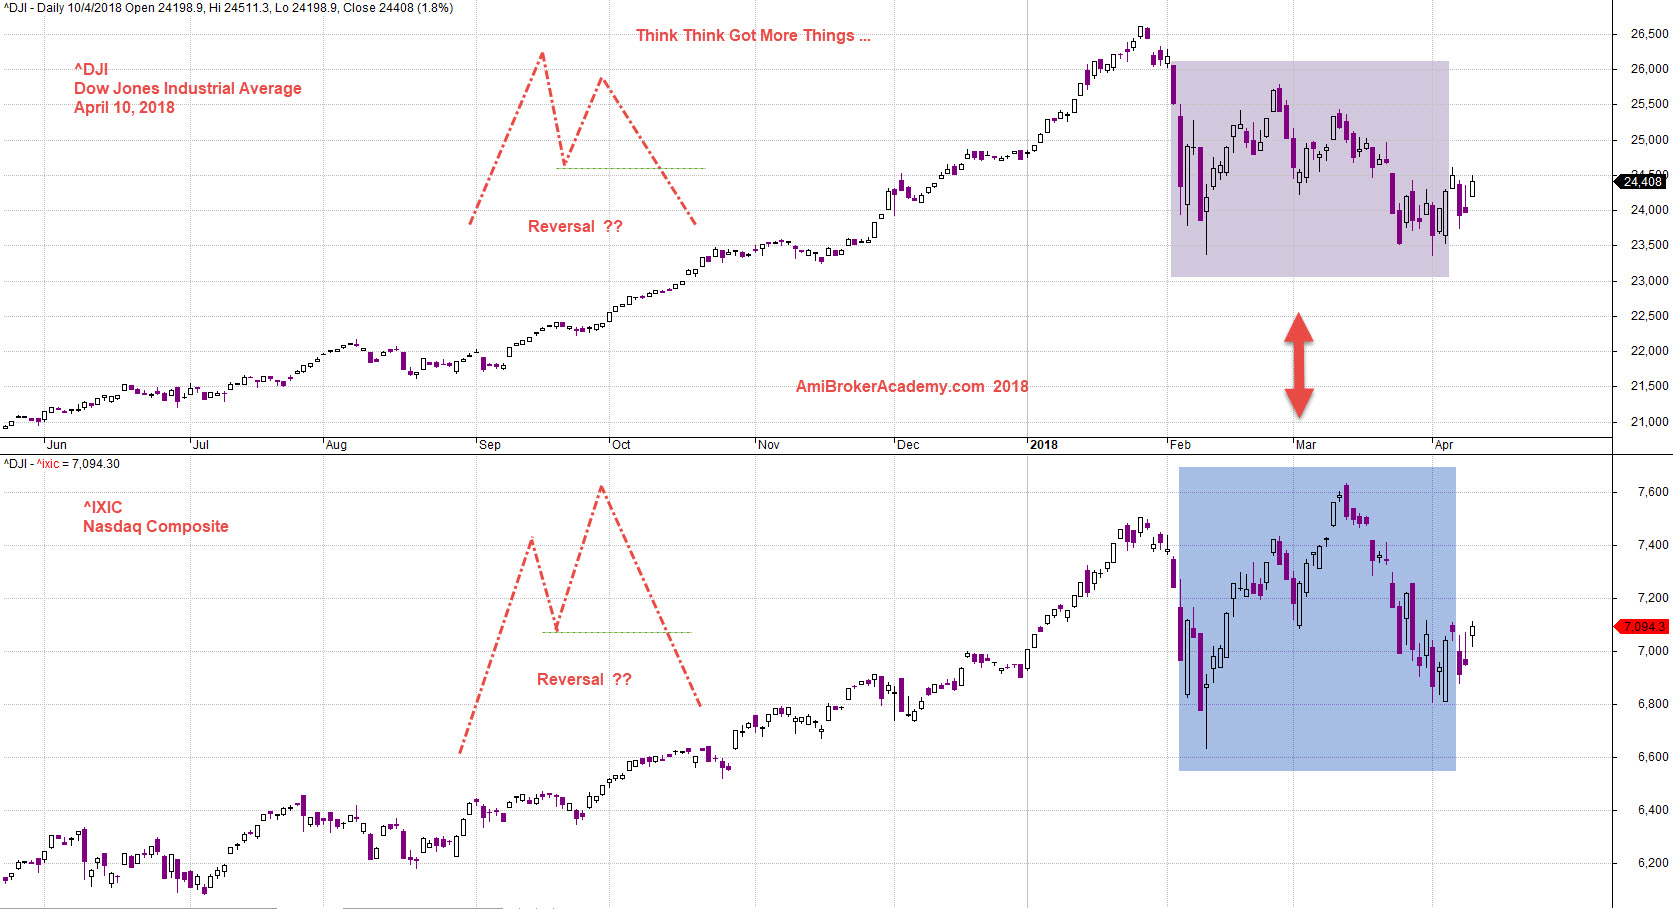
April 10, 2018 Dow Jones and NASDAQ Correlation
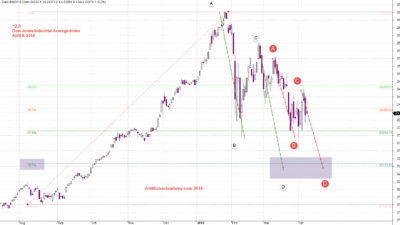
April 9, 2018 Dow Jones Industrial Average and Fibonacci Retracement 78%
^DJI Dow Jones Industrial Average and ABCD Pattern
See chart for more, picture worth a thousand words. Remember, all setup can fail. Manage your risk.
Moses US Stock Chart Analysis
AmiBrokerAcademy.com
Disclaimer
The above result is for illustration purpose. It is not meant to be used for buy or sell decision. We do not recommend any particular stocks. If particular stocks of such are mentioned, they are meant as demonstration of Amibroker as a powerful charting software and MACD. Amibroker can program to scan the stocks for buy and sell signals.
These are script generated signals. Not all scan results are shown here. The MACD signal should use with price action. Users must understand what MACD and price action are all about before using them. If necessary you should attend a course to learn more on Technical Analysis (TA) and Moving Average Convergence Divergence, MACD.
Once again, the website does not guarantee any results or investment return based on the information and instruction you have read here. It should be used as learning aids only and if you decide to trade real money, all trading decision should be your own.