31 October, 2018
Thanks for visiting the site.
Moses Stock Stories – Think Think Got More Things
1810.HK Xiaomi Corporation Charting
We study Xiaomi stock chart. We see Xiaomi stock price drop from IPO down to the current low. At the peak for Xiaomi was slightly above 22 HK$, and now is below 12 HK$. You could spot the H M Gartley 222 pattern. If you have missed to own this stock at IPO time, is it a good to to purchase them? Well, no right no wrong in trading stock. But at this point, the MA is wide open. the bear trend is still strong. Trade with your eyes open.
You could also easily spot H M Gartley 222 pattern. See the next chart.
Manage Your Risk!
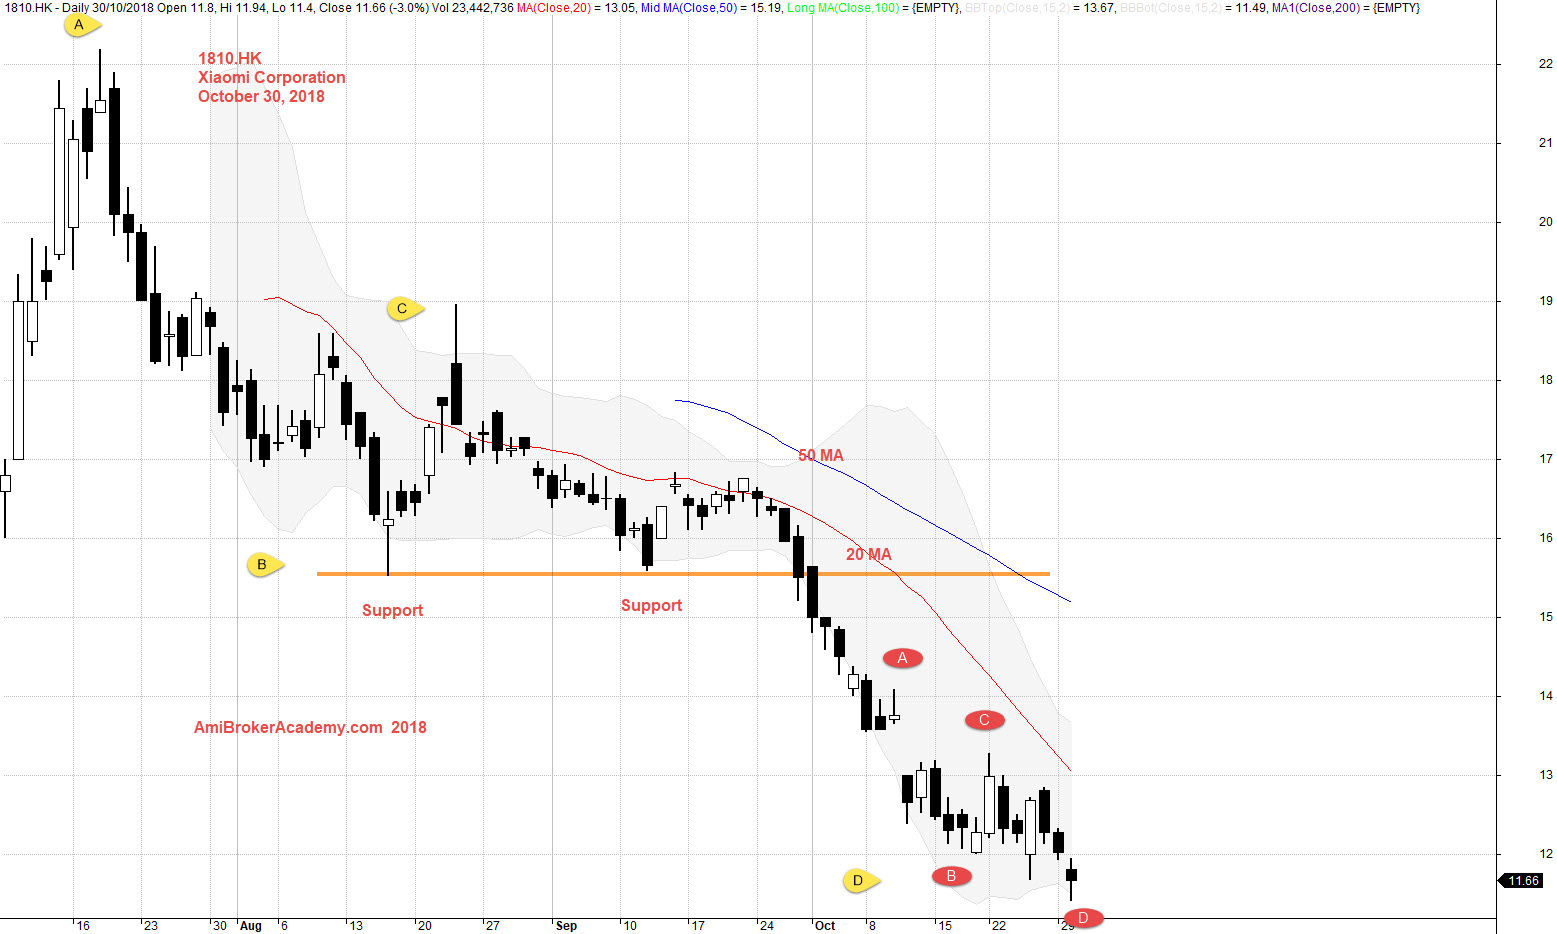
October 30, 2018 Xiaomi Corporation and Moving Averages
If you can see the whole chart, “press Ctrl and -” to zoom out to see the entire chart.
Add the MACD indicator, see chart. MACD cross up signal fail. Manage your risk.
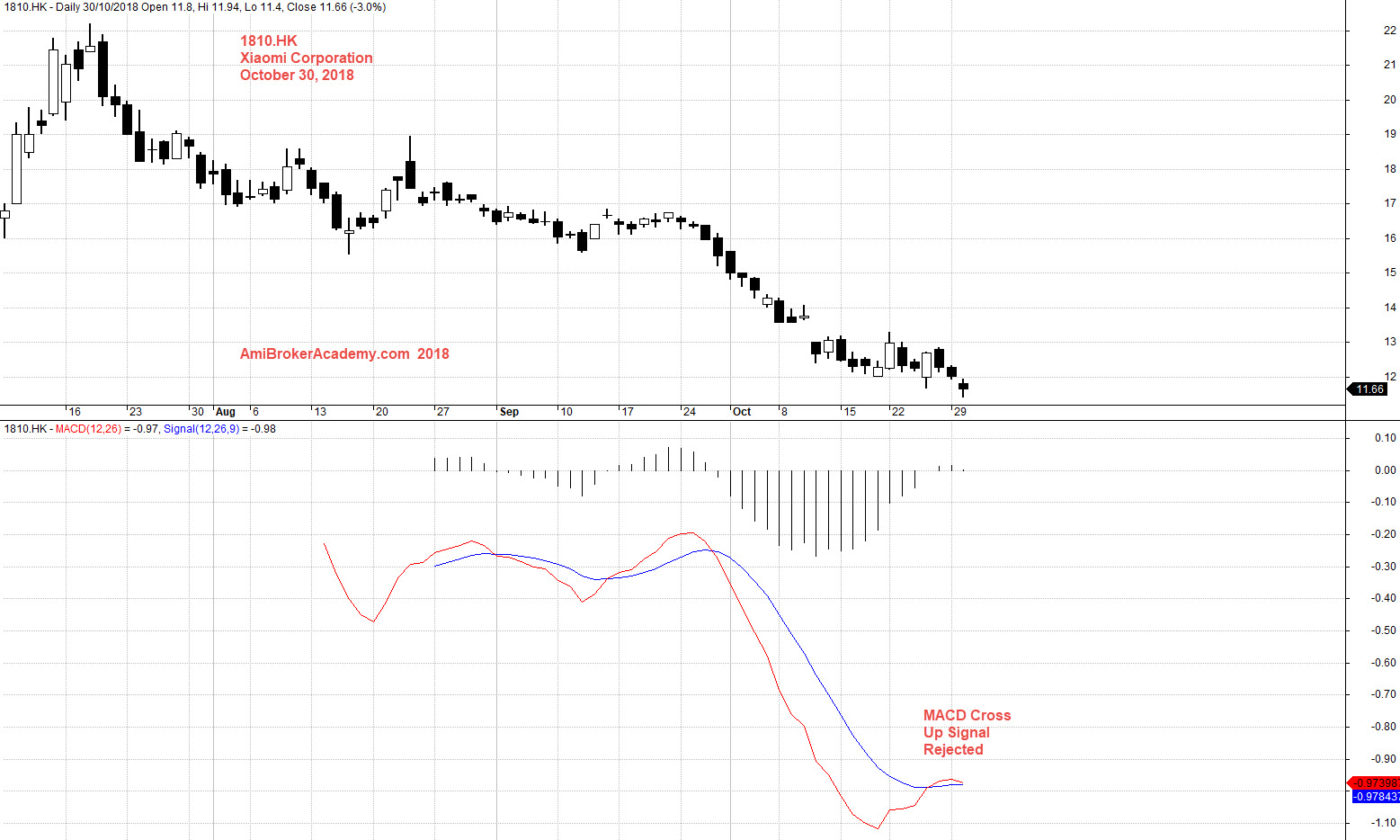
October 30, 2018 Xiaomi Corporation and MACD
Moses
AmiBrokerAcademy.com
Disclaimer
The above result is for illustration purpose. It is not meant to be used for buy or sell decision. We do not recommend any particular stocks. If particular stocks of such are mentioned, they are meant as demonstration of Amibroker as a powerful charting software and MACD. Amibroker can program to scan the stocks for buy and sell signals.
These are script generated signals. Not all scan results are shown here. The MACD signal should use with price action. Users must understand what MACD and price action are all about before using them. If necessary you should attend a course to learn more on Technical Analysis (TA) and Moving Average Convergence Divergence, MACD.
Once again, the website does not guarantee any results or investment return based on the information and instruction you have read here. It should be used as learning aids only and if you decide to trade real money, all trading decision should be your own.