April 7, 2019
Thanks for visit the site here. Hope you find the read interesting.
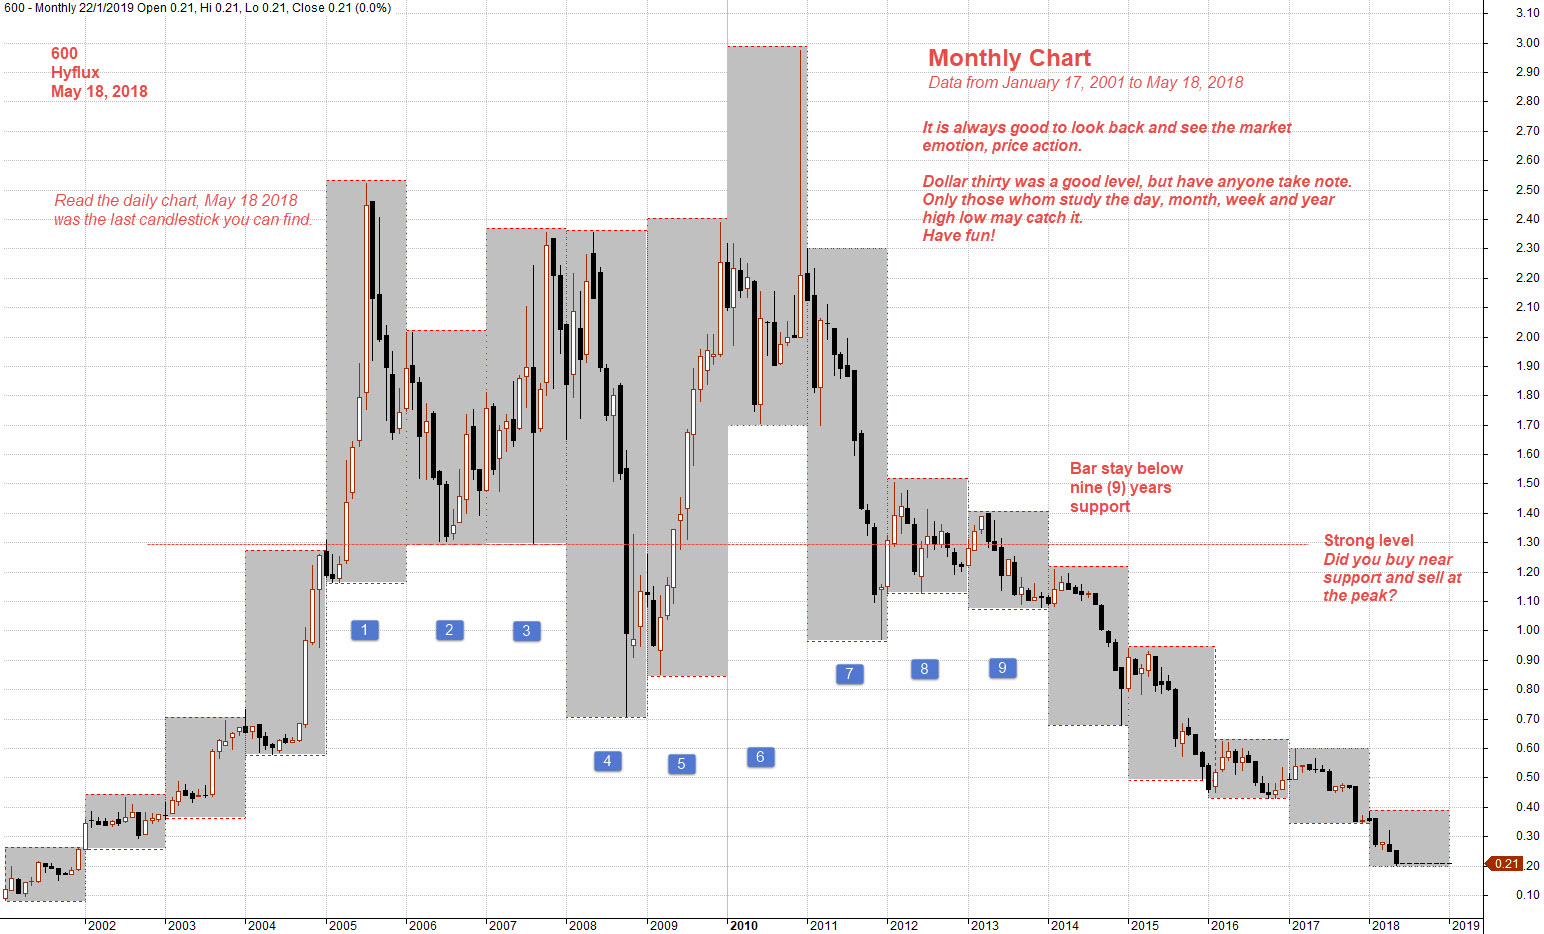
Think think got more things. This could be the last chance you see the stock chart. The stock chart from the day-one, back to January 17, 2001.
600 Hyflux Stock Charting
Study Hyflux stock chart and Year High Low.
See chart, picture worth a thousand words. This stock was very volatile; the year candlestick is huge.
If you ever stand back and watch the chart, you will say why I did not see the strong level.
It is always good to look back and see the market emotion, price action.
Dollar thirty was a good level, but have anyone take notice. Only those whom study the day, month, week and year high low may catch it. Have fun!
Hope you draw a lesson from this stock. Any good news is bad news. The stock price is a market perception.
Trade with eyes open.
Moses Stock Chart Analysis
AmiBrokerAcademy.com
Disclaimer
The above result is for illustration purpose. It is not meant to be used for buy or sell decision. We do not recommend any particular stocks. If particular stocks of such are mentioned, they are meant as demonstration of Amibroker as a powerful charting software and MACD. Amibroker can program to scan the stocks for buy and sell signals.
These are script generated signals. Not all scan results are shown here. The MACD signal should use with price action. Users must understand what MACD and price action are all about before using them. If necessary you should attend a course to learn more on Technical Analysis (TA) and Moving Average Convergence Divergence, MACD.
Once again, the website does not guarantee any results or investment return based on the information and instruction you have read here. It should be used as learning aids only and if you decide to trade real money, all trading decision should be your own.