1 April, 2018
US Stock Chart Analysis
Coca-Cola Company Stock Charting – Think Think Got More Things
Study Coca-Cola Company Stock Price, see chart the stock price breakout higher than 2017 high at 47.5, and reach the peak above 48.5 in 2018. But the stock price since then the stock price drift lower, many should not described as drift. Fall like water fall may be more correct in describing the big drop. The stock price is currently supported near 78%. If the fall continue, the whole move in 2017 will be whipped out. Manage your trade. It is difficult to tell when to take your profit.
Powerful Chart Software – AmiBroker
The following chart is produced using AmiBroker charting software. It is a powerful chart software. Anything, finance ticket you could download from Yahoo! Finance you could plot them, those you are interested all in a chart, so you could analyse them.
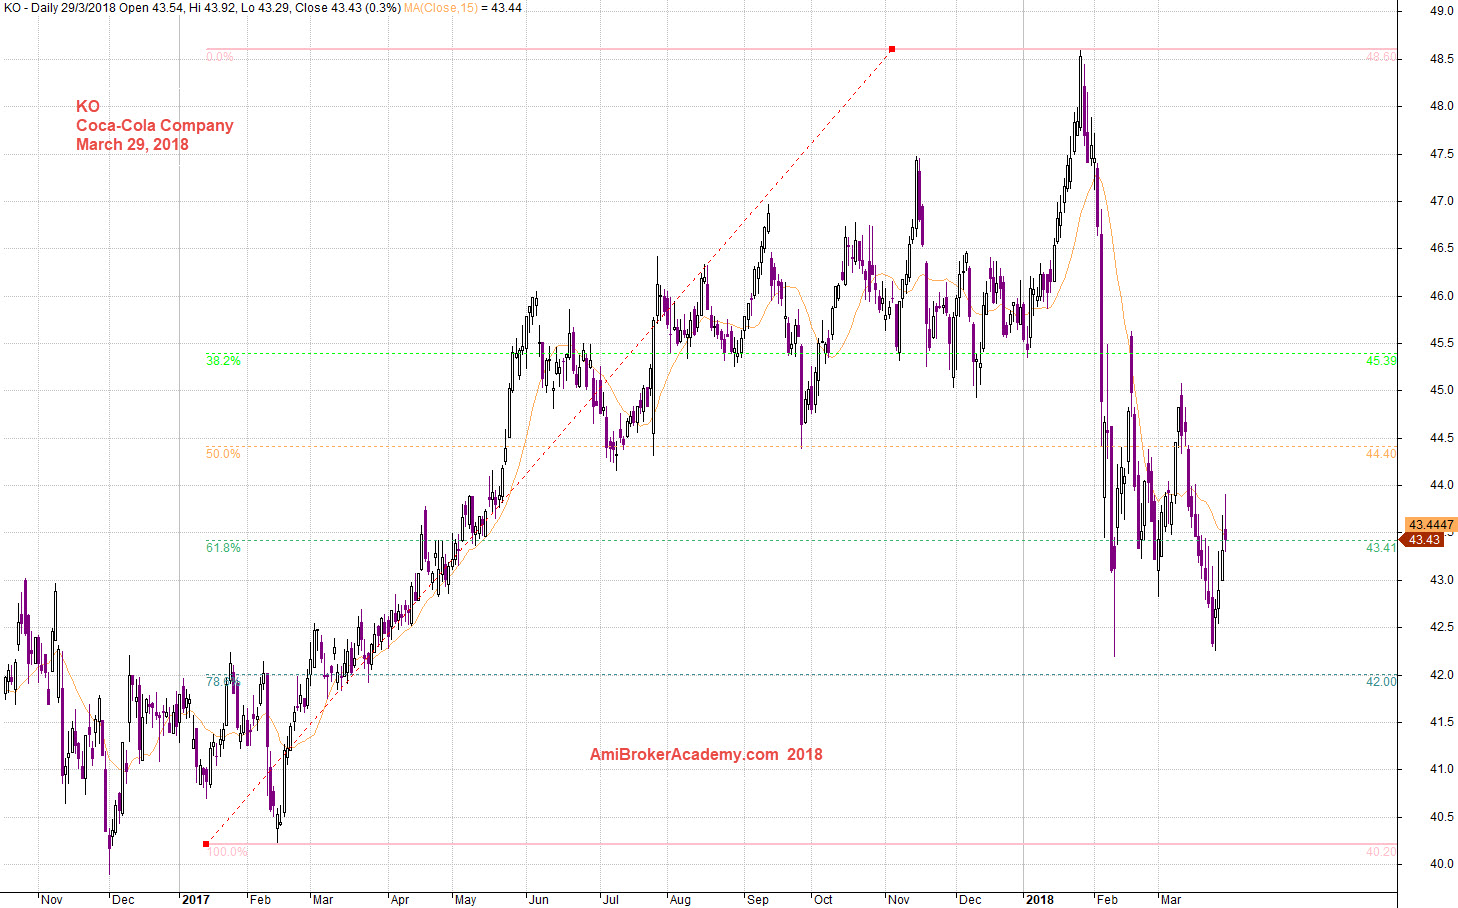
March 29, 2018 Coca-Cola Company Charting and Fibonacci Retracement
Moses Stock Chart Analysis
AmiBrokerAcademy.com
Disclaimer
The above result is for illustration purpose. It is not meant to be used for buy or sell decision. We do not recommend any particular stocks. If particular stocks of such are mentioned, they are meant as demonstration of Amibroker as a powerful charting software and MACD. Amibroker can program to scan the stocks for buy and sell signals.
These are script generated signals. Not all scan results are shown here. The MACD signal should use with price action. Users must understand what MACD and price action are all about before using them. If necessary you should attend a course to learn more on Technical Analysis (TA) and Moving Average Convergence Divergence, MACD.
Once again, the website does not guarantee any results or investment return based on the information and instruction you have read here. It should be used as learning aids only and if you decide to trade real money, all trading decision should be your own.