15 January, 2019
Think think got more things.
Thanks for visiting the site.
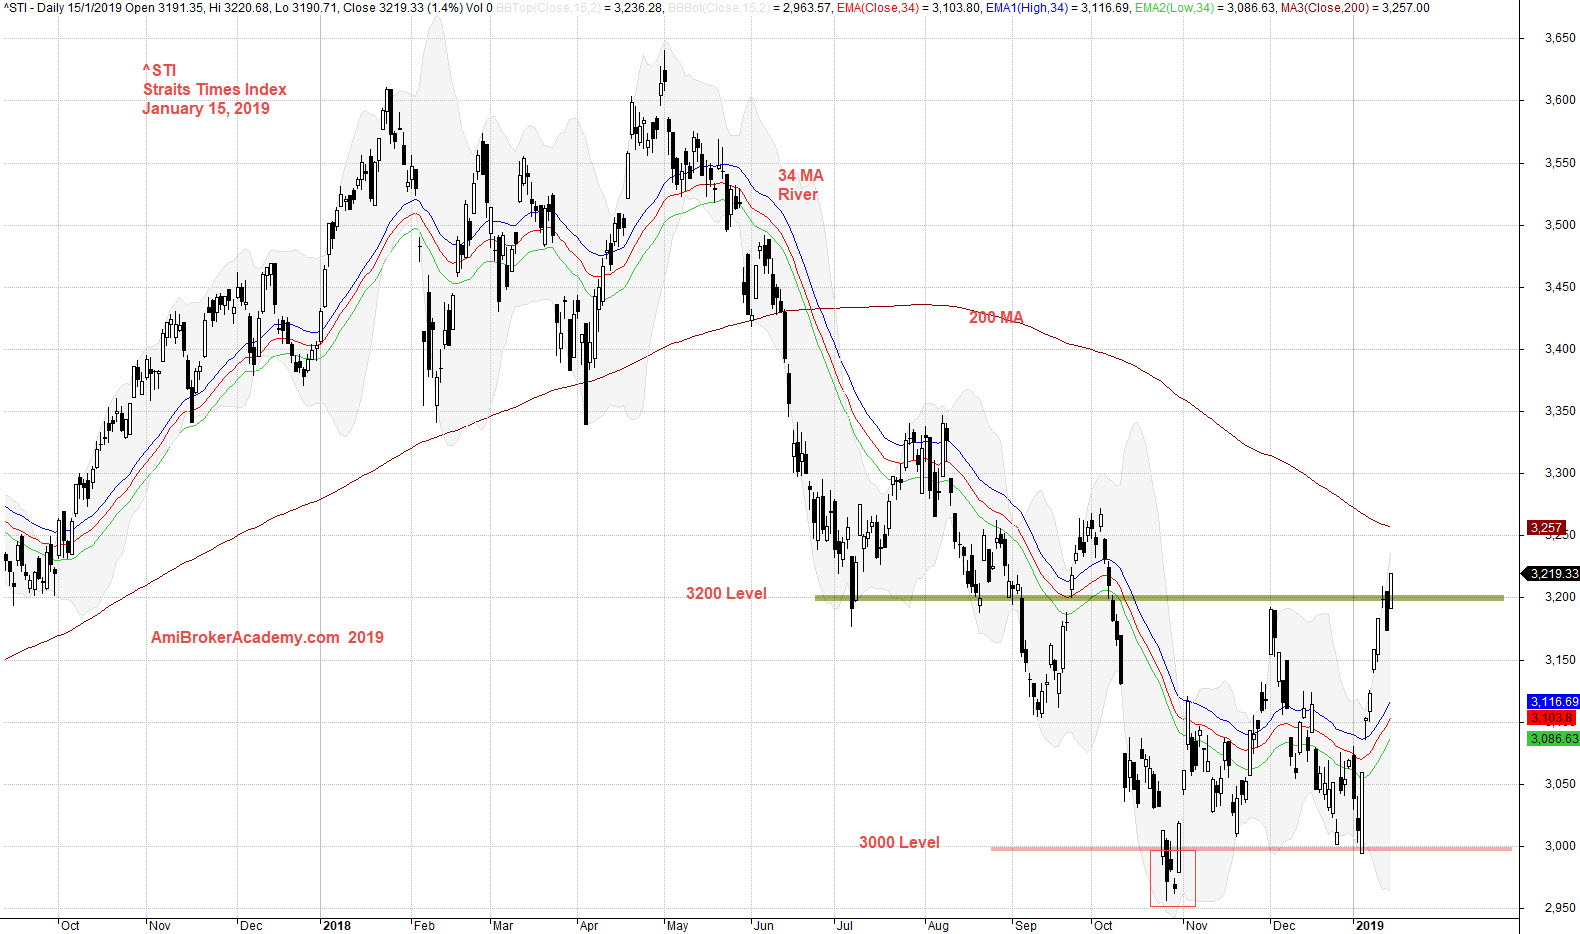
^STI Singapore Straits Times Index Charting
Study Singapore Straits Times Index stock chart. ST Index to certain extend is used to benchmark the Singapore economy. Is it true? Will see.
Study chart, the peak seem to be over, last year the price action tested 3600 level a few times. Thereafter the price action fail to continue to have the strength to hold up the price action. The price action begin to look south and move downward speedily.
ST Index breakout below 3000 level, an import level for many of the investor.
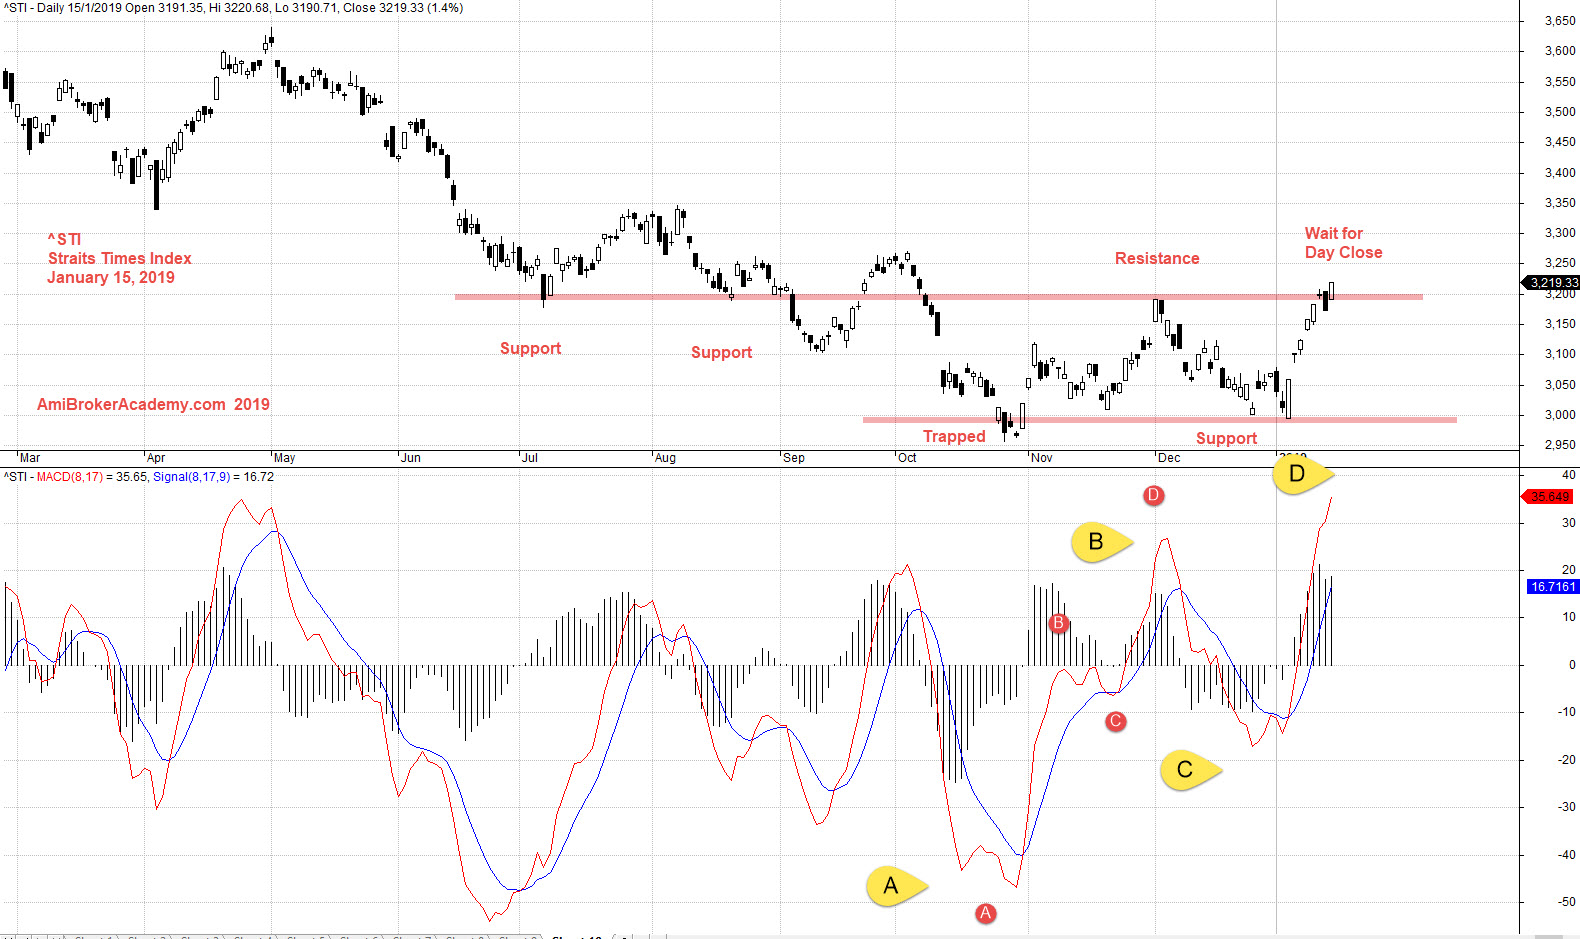
After falling below 3000 level the price action begin to retrace up. Price action make a “W” pattern. Now the price action is resisted by the 3200 level.
Question now, can the price action continue to breakout the 3200 level and get resisted and return the action back to test the 3000 level. Will see.
Remember only three more weeks will be Chinese New Year, to many of the investor. If they are doing good so far they will not want to rock the boat and have a unhappy CNY. For those that has missed they also do not want to have the worrisome CNY. The last group that they had done badly for 2018, they even more worry to wait for great opportunity. The test of 3200 level break not break is a good sign to join the flow. I don’t think so.
Think think before you act.
Trade with your eyes open.
Study ST Index using MACD indicator. Apply ABCD pattern on MACD. To be true any chart can use ABCD pattern to understand where the price action is heading. See chart look like the last CD leg is done. So. where will the price action goes?
Trade with your eyes open.
Moses Stock Chart Analysis
AmiBrokerAcademy.com
Disclaimer
The above result is for illustration purpose. It is not meant to be used for buy or sell decision. We do not recommend any particular stocks. If particular stocks of such are mentioned, they are meant as demonstration of Amibroker as a powerful charting software and MACD. Amibroker can program to scan the stocks for buy and sell signals.
These are script generated signals. Not all scan results are shown here. The MACD signal should use with price action. Users must understand what MACD and price action are all about before using them. If necessary you should attend a course to learn more on Technical Analysis (TA) and Moving Average Convergence Divergence, MACD.
Once again, the website does not guarantee any results or investment return based on the information and instruction you have read here. It should be used as learning aids only and if you decide to trade real money, all trading decision should be your own.