July 9, 2017
Moving Average is A Great Visual Tool
TSLA Tesla Motors Inc and Share Prices and Moving Averages
Picture worth a thousand words.
Share price break 50-day Moving Average, and seems may be supported by 100 MA. True or true? WOMD, wait one more day. Remember professional trade retracement.
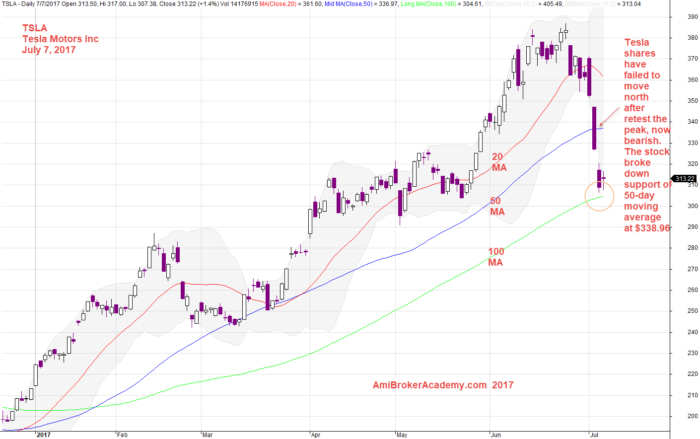
July 7, 2017 TSLA Tesla Motors Inc and Moving Averages
Risk
If you can wait, remember professional likes to wait for retracement. This will minimize the risk, as your stop loss will be smaller. So, picture worth a thousand words. In this case study, if you wait for pullback, you will have a handson gain; you can enjoy a big move in short time. Waw!
Professional Try Not to Buy and Sell Higher!
Professional trade on retracement.
What if you thought you miss and you jump in. You may be ended up you can not sleep for a days. … As you might be buy high and expecting to sell higher.
Moses
AmiBrokerAcademy.com
Disclaimer
The above result is for illustration purpose. It is not meant to be used for buy or sell decision. We do not recommend any particular stocks. If particular stocks of such are mentioned, they are meant as demonstration of Amibroker as a powerful charting software and MACD. Amibroker can program to scan the stocks for buy and sell signals.
These are script generated signals. Not all scan results are shown here. The MACD signal should use with price action. Users must understand what MACD and price action are all about before using them. If necessary you should attend a course to learn more on Technical Analysis (TA) and Moving Average Convergence Divergence, MACD.
Once again, the website does not guarantee any results or investment return based on the information and instruction you have read here. It should be used as learning aids only and if you decide to trade real money, all trading decision should be your own.