December 5, 2018
Elliott Wave | Singapore Tech Company | AWX | AEM Holdings Charting | AmiBrokerAcademy.com
Let’s study another tech stock. Picture worth a thousand words. Is tech stock doing well in Singapore? You say lah.
Think think got more things.
Thanks for visiting the site.
BN2 Valuetronics Holdings Charting
Study Valuetronics Holdings chart using the wave count, you could see how the price action move. The price action tested the high above 1.10 dollars and fail. The price action moves down fast. The price action test the low at sixty cents. See chart.
Trade with your eyes open.
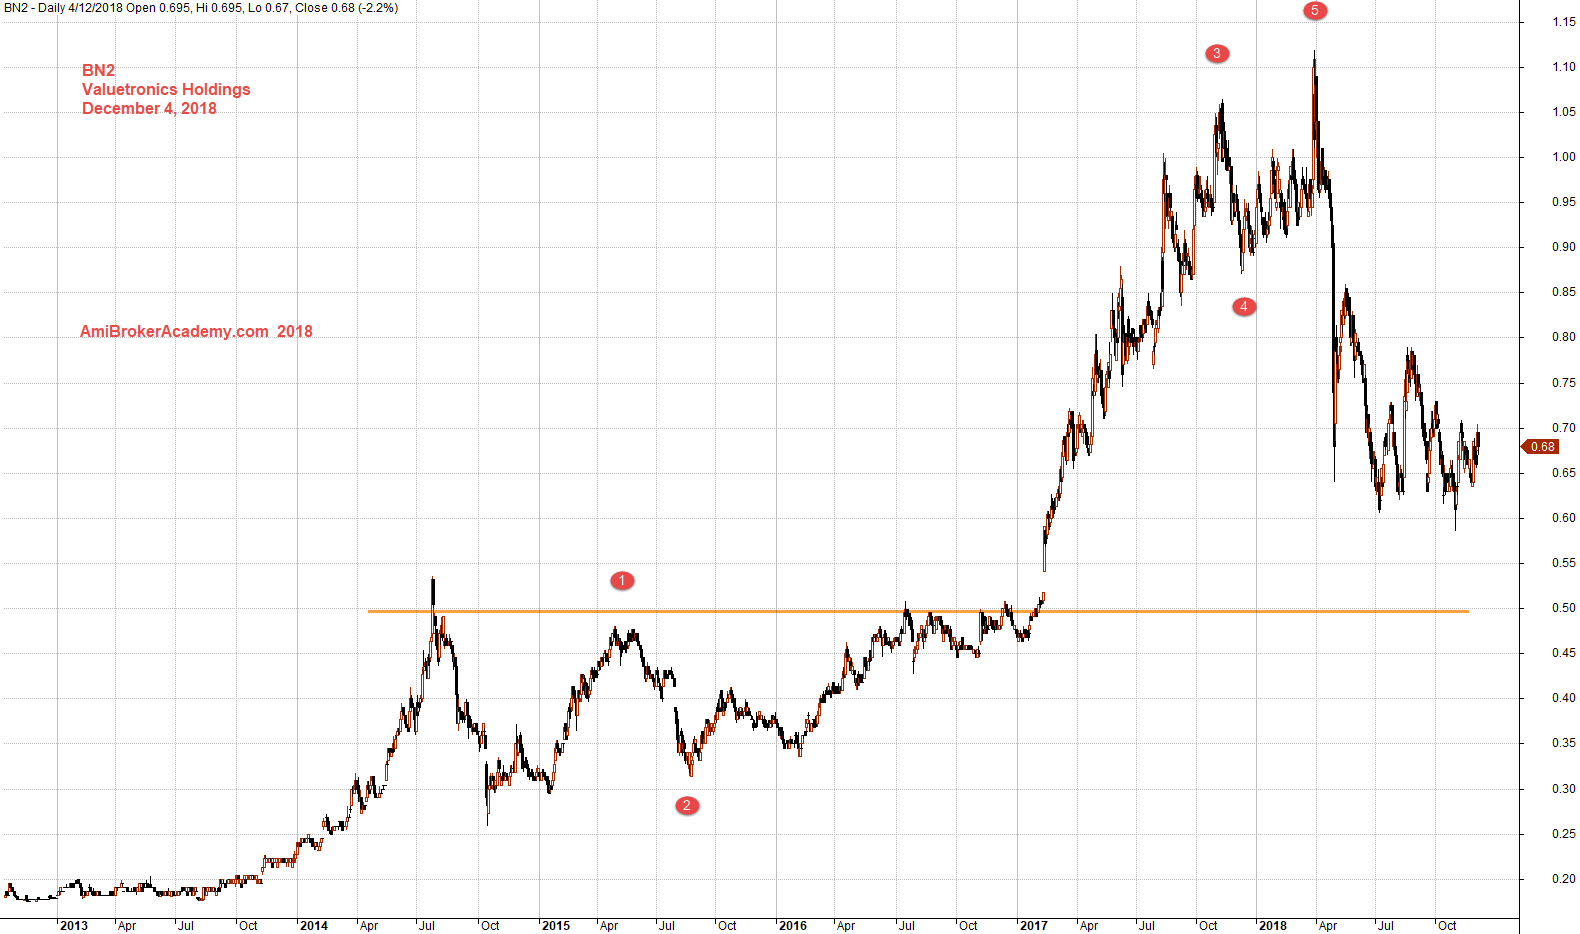
December 4, 2018 Valuetronics Holdings and Wave Count
if you can see the full chart, “press Ctrl and -” to zoom out and see the entire chart.
Zoom in, add MACD indicator, see chart. And do not forget to trade with your eyes open.
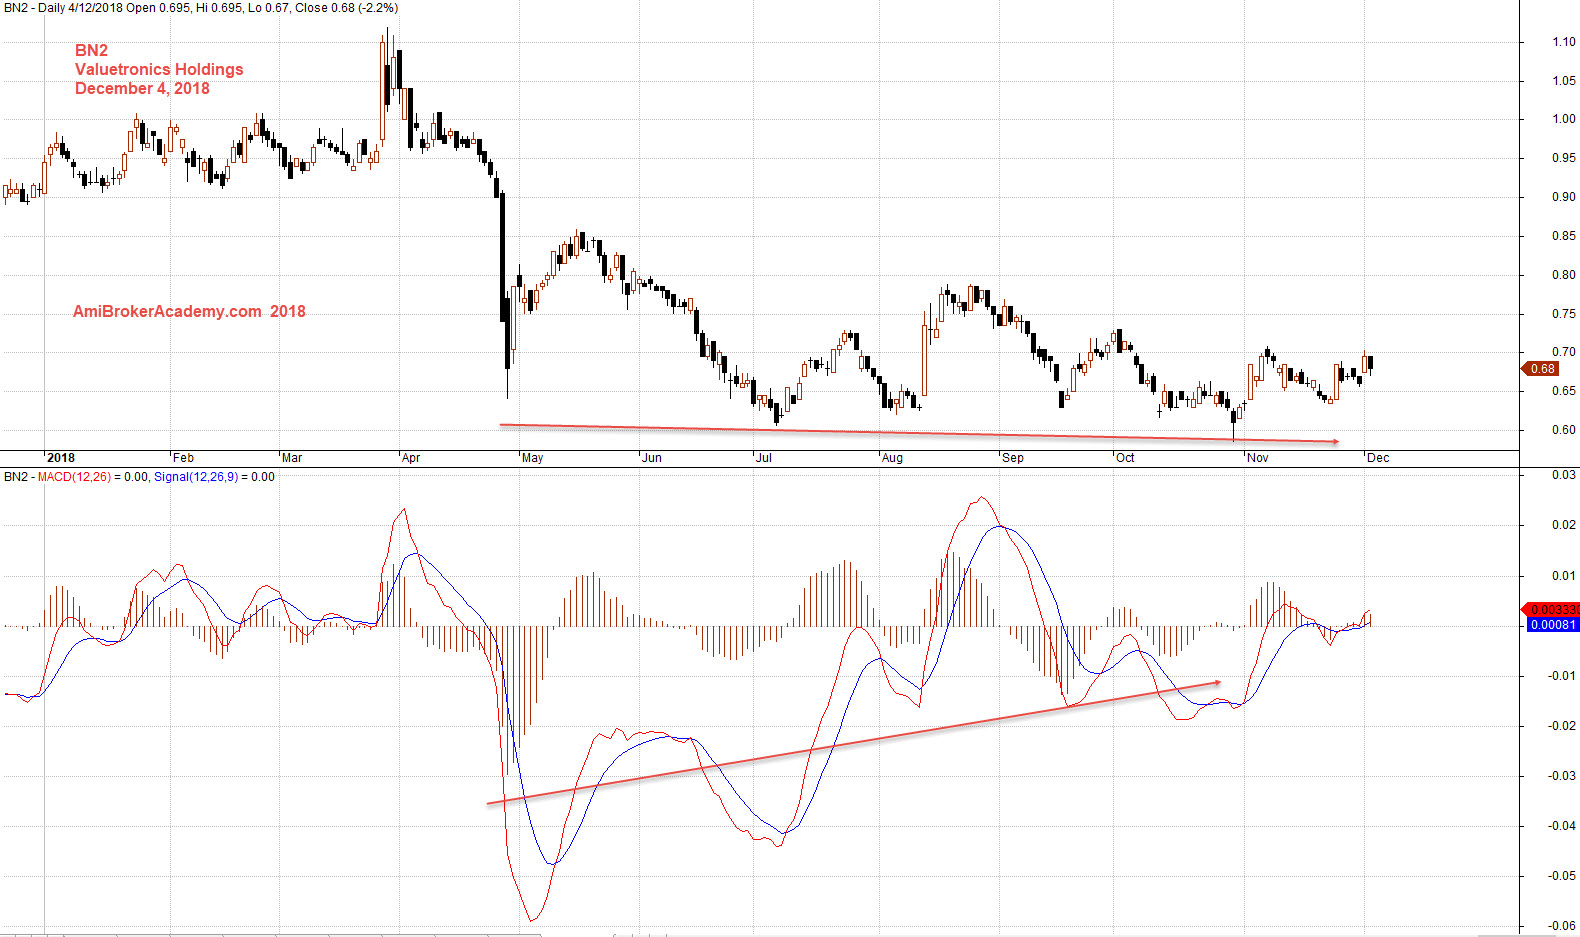
December 4, 2018 Valuetronics Holdings and MACD
Moses US Stock Chart Analysis
AmiBrokerAcademy.com
Disclaimer
The above result is for illustration purpose. It is not meant to be used for buy or sell decision. We do not recommend any particular stocks. If particular stocks of such are mentioned, they are meant as demonstration of Amibroker as a powerful charting software and MACD. Amibroker can program to scan the stocks for buy and sell signals.
These are script generated signals. Not all scan results are shown here. The MACD signal should use with price action. Users must understand what MACD and price action are all about before using them. If necessary you should attend a course to learn more on Technical Analysis (TA) and Moving Average Convergence Divergence, MACD.
Once again, the website does not guarantee any results or investment return based on the information and instruction you have read here. It should be used as learning aids only and if you decide to trade real money, all trading decision should be your own.