1 May, 2018
As We Question in April 1, Is It A Good Time to Buy?
US Stock Chart Analysis
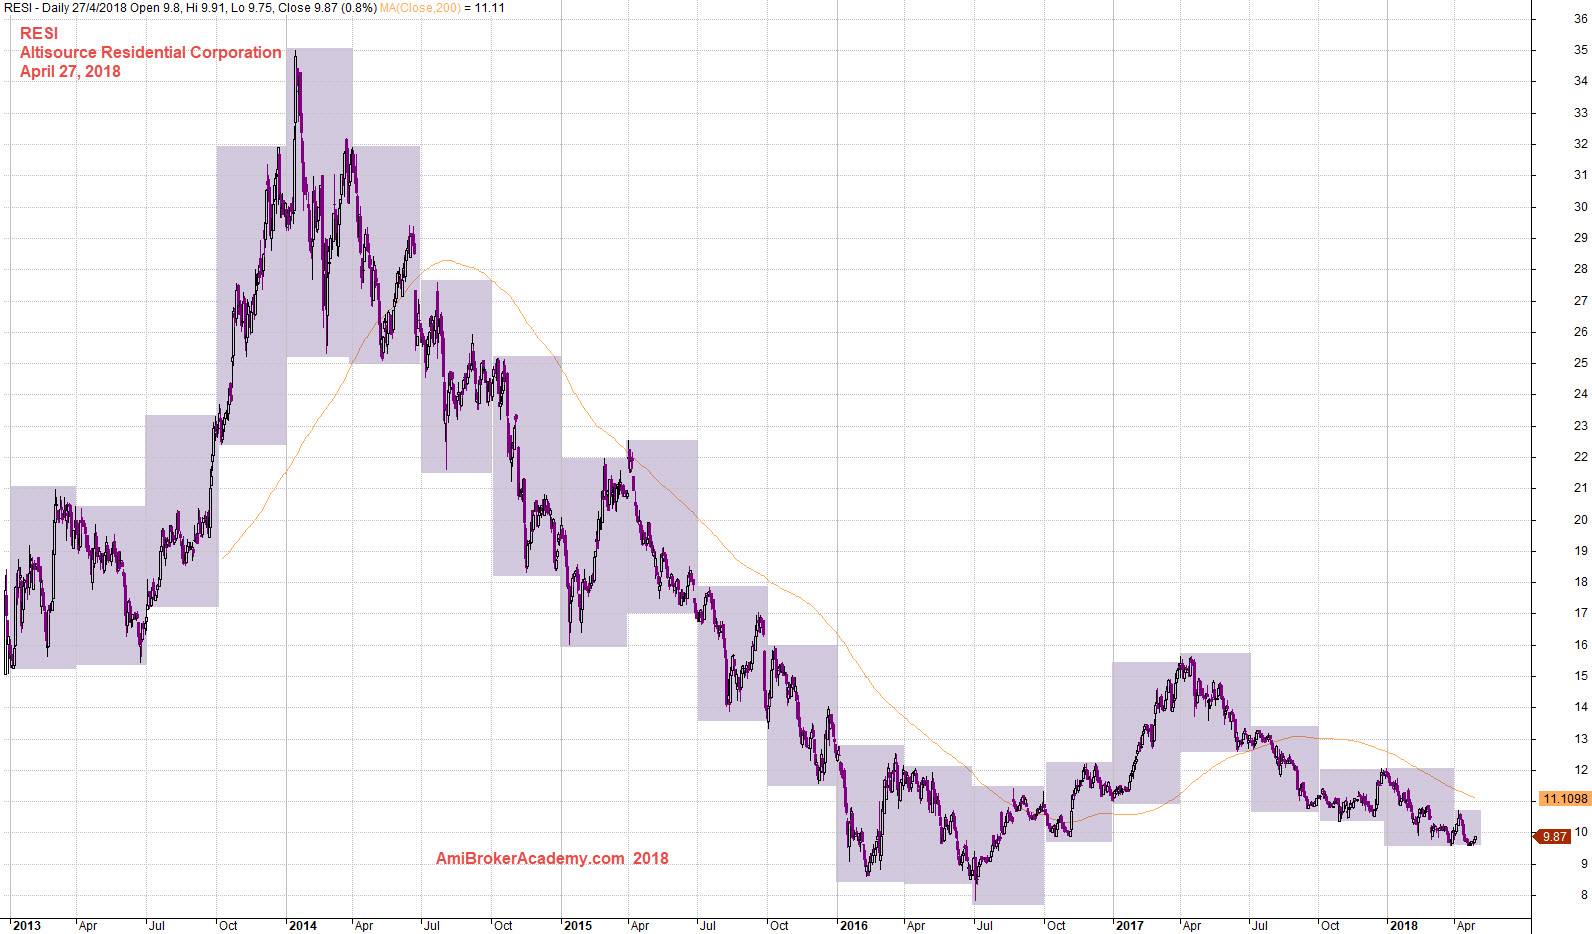
RESI Altisource Residential Corporation and Support Resistance
Study Altisource Residential Corporation using support resistance. the price action close below 200 MA and stay below MA from July 2014 till October 2016. The price action closed up above 200 MA from October 2016 till July 2017. The stock price goes below 200 MA since then till now. Manage your trade.
Manage your risk!
Powerful Chart Software – AmiBroker
The following chart is produced using AmiBroker charting software. It is a powerful chart software. Anything, finance ticket you could download from Yahoo! Finance you could plot them, those you are interested all in a chart, so you could analyse them.
April 27, 2018 Altisource Residential Corporation and Support Resistance
The chart of last posting.
Moses US Stock Chart Analysis
AmiBrokerAcademy.com
Disclaimer
The above result is for illustration purpose. It is not meant to be used for buy or sell decision. We do not recommend any particular stocks. If particular stocks of such are mentioned, they are meant as demonstration of Amibroker as a powerful charting software and MACD. Amibroker can program to scan the stocks for buy and sell signals.
These are script generated signals. Not all scan results are shown here. The MACD signal should use with price action. Users must understand what MACD and price action are all about before using them. If necessary you should attend a course to learn more on Technical Analysis (TA) and Moving Average Convergence Divergence, MACD.
Once again, the website does not guarantee any results or investment return based on the information and instruction you have read here. It should be used as learning aids only and if you decide to trade real money, all trading decision should be your own.