April 24 2018
China stock market influenced by the recent US policy. Will see.
Study the Shanghai Stock Index for more.
Shanghai Stock Chart Analysis
000001.SS Shanghai Stock Exchange Composite Index and Month Support Resistance
Manage your risk! Study Shanghai Stock Exchange Composite Index month support resistance. See chart, picture worth a thousand words. The stock price is approaching last May low. Manage your risk.
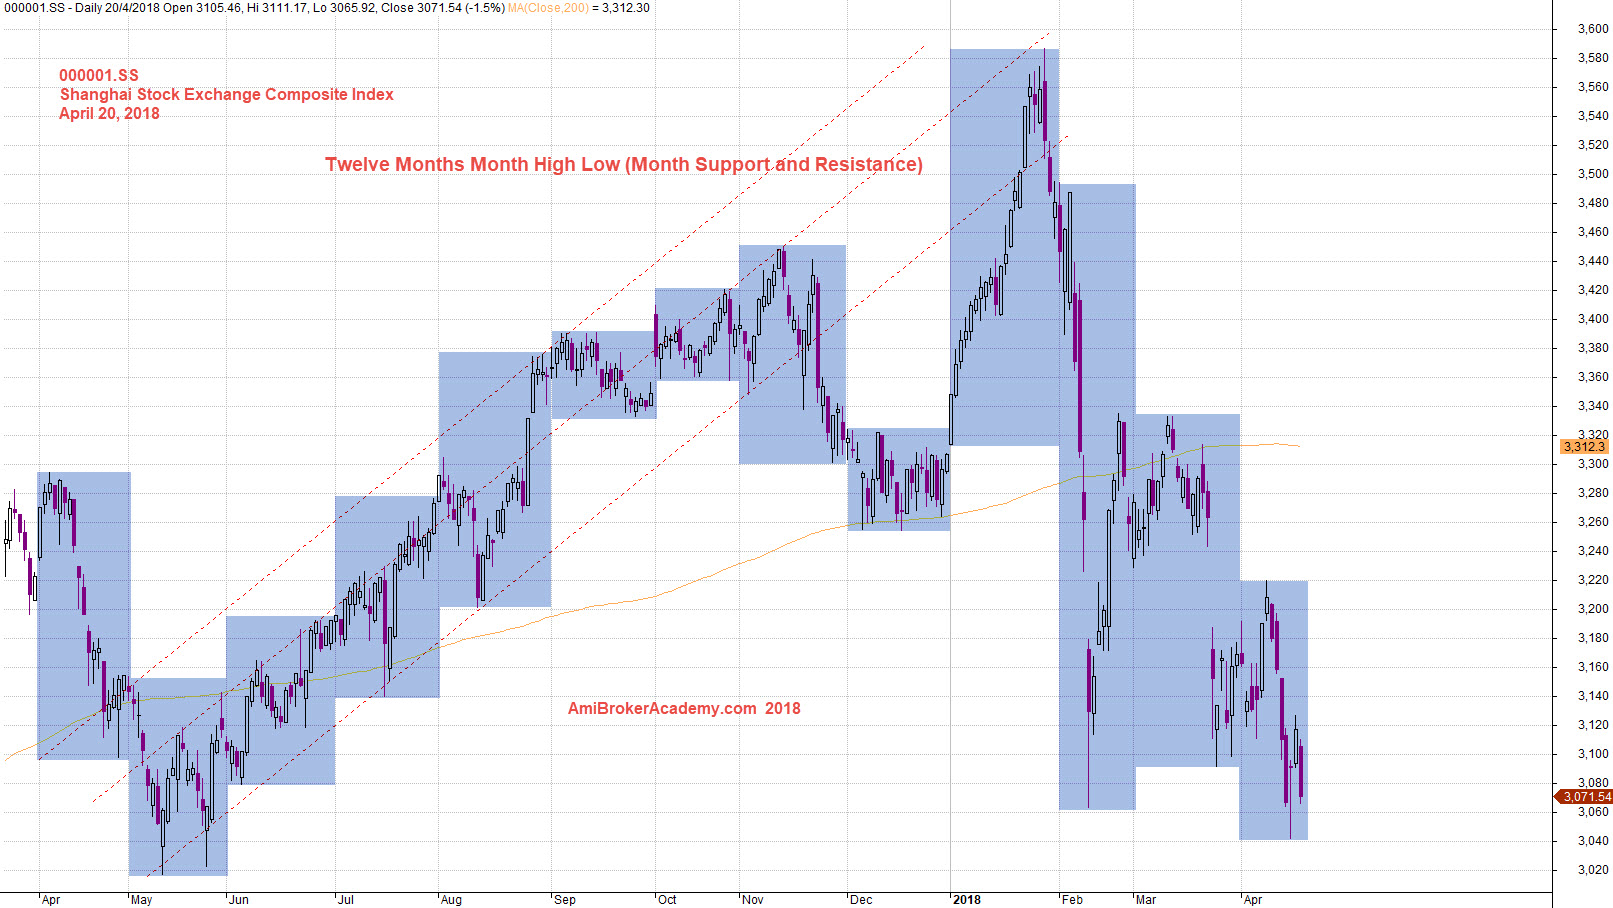
April 20, 2018 Shanghai Stock Exchange Composite Index and Month Support Resistance
Shanghai Stock Exchange Composite Index and MA Wave
Study Shanghai Stock Exchange Composite Index using MA Wave. Using MA high, low and close to form a river or wave. See chart, picture worth a thousand words. The stock price crosses below MA wave, the price action resisted by MA wave. MA Wave is slopping down. Bearish. Manage your risk.
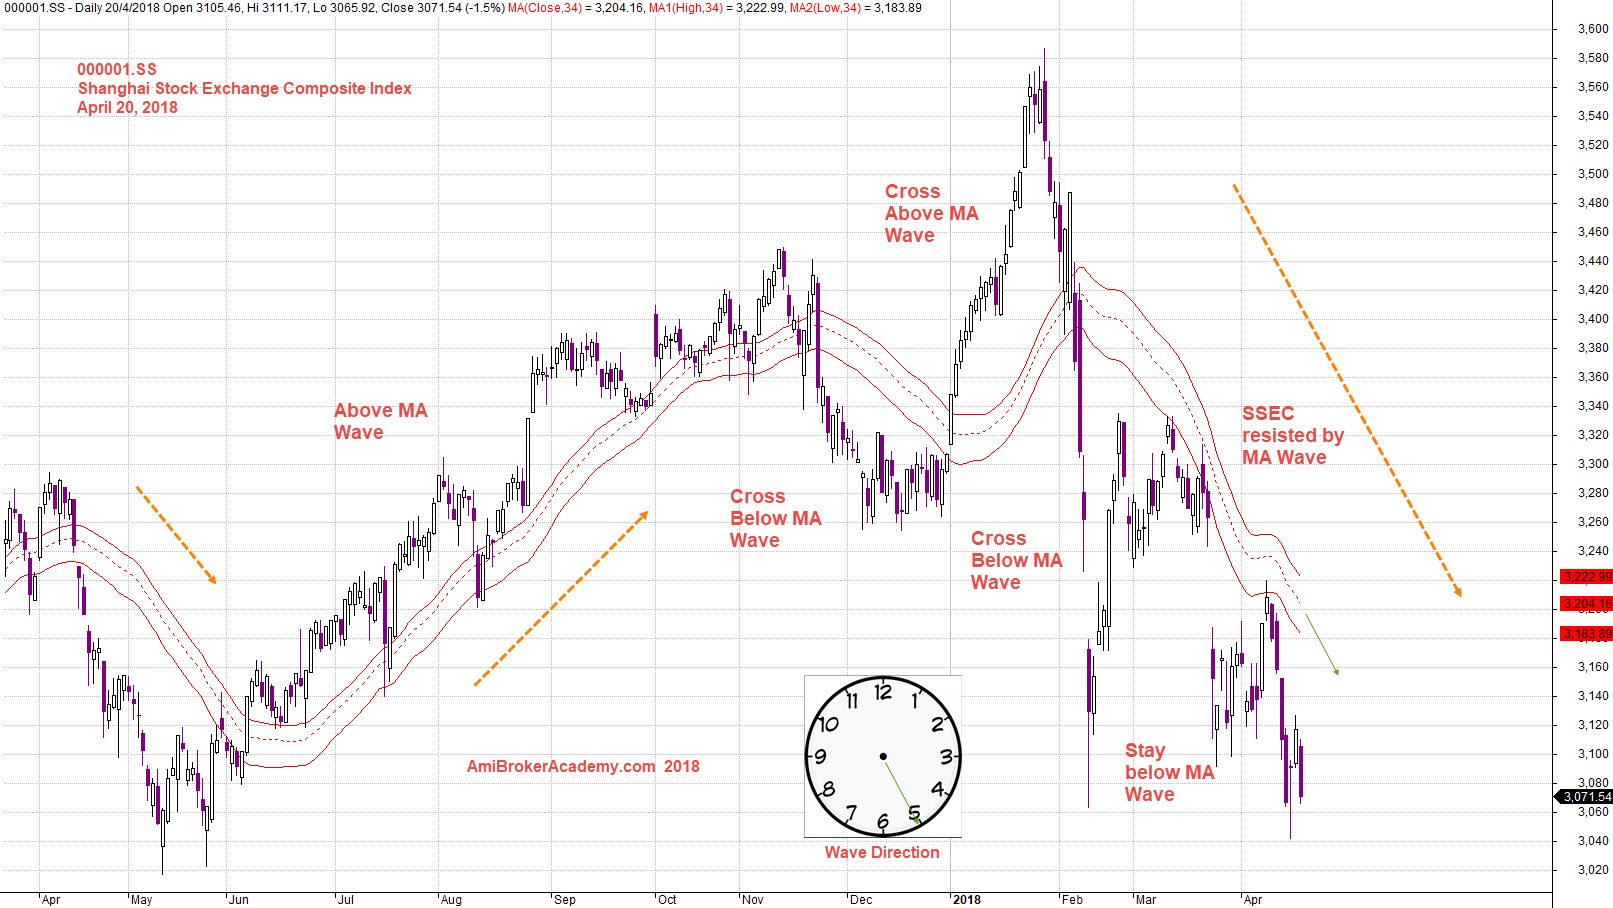
April 20, 2018 Shanghai Stock Exchange Composite Index and MA Wave and Direction
Shanghai Stock Exchange Composite Index and Fibonacci
Study Shanghai Stock Exchange Composite Index using Fibonacci. Swing low to high, draw a Fibonacci Extension, after the price action touch the 150%, the stock price breakout below the resistance and stay below resistance, see the orange horizontal line. Manage your risk.
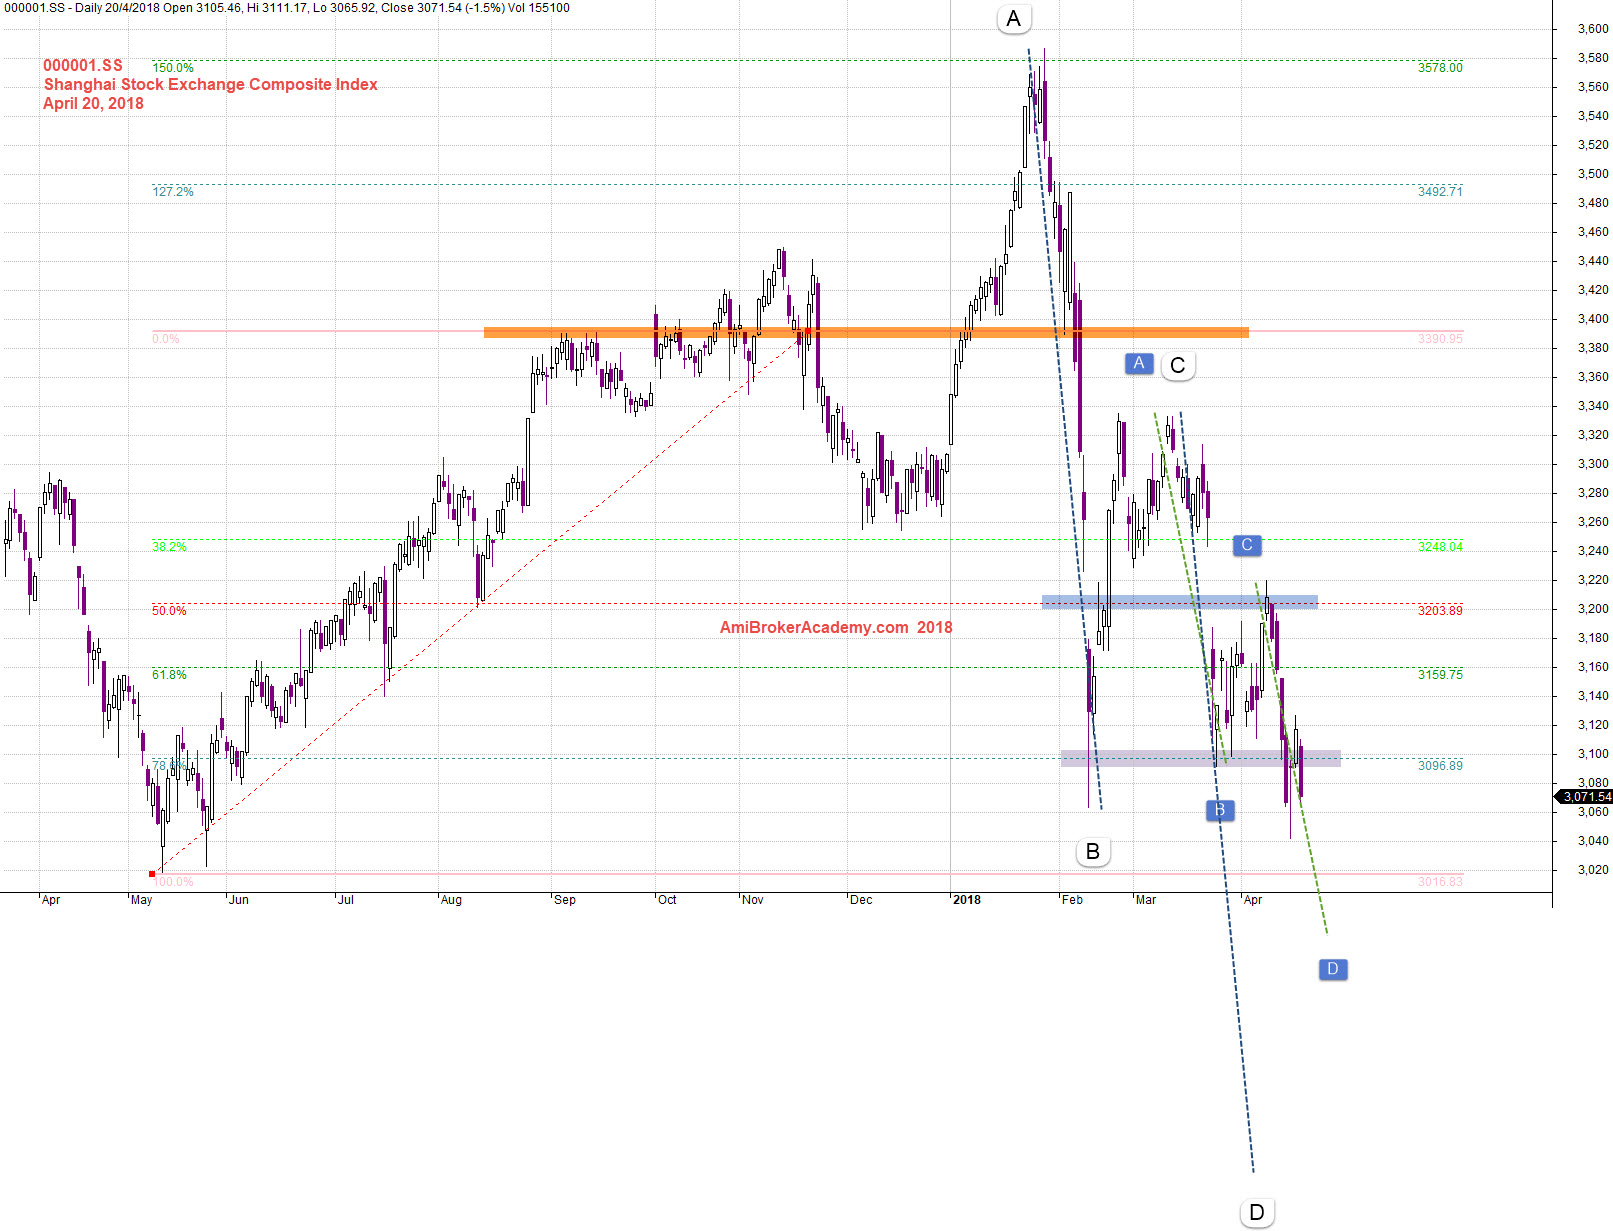
April 20, 2018 Shanghai Stock Exchange Composite Index and Fibo Extension Low to High
Shanghai Stock Exchange Composite Index and MACD
Study Shanghai Stock Exchange Composite Index using MACD. Picture worth a thousand words, see chart for more. Manage your risk.
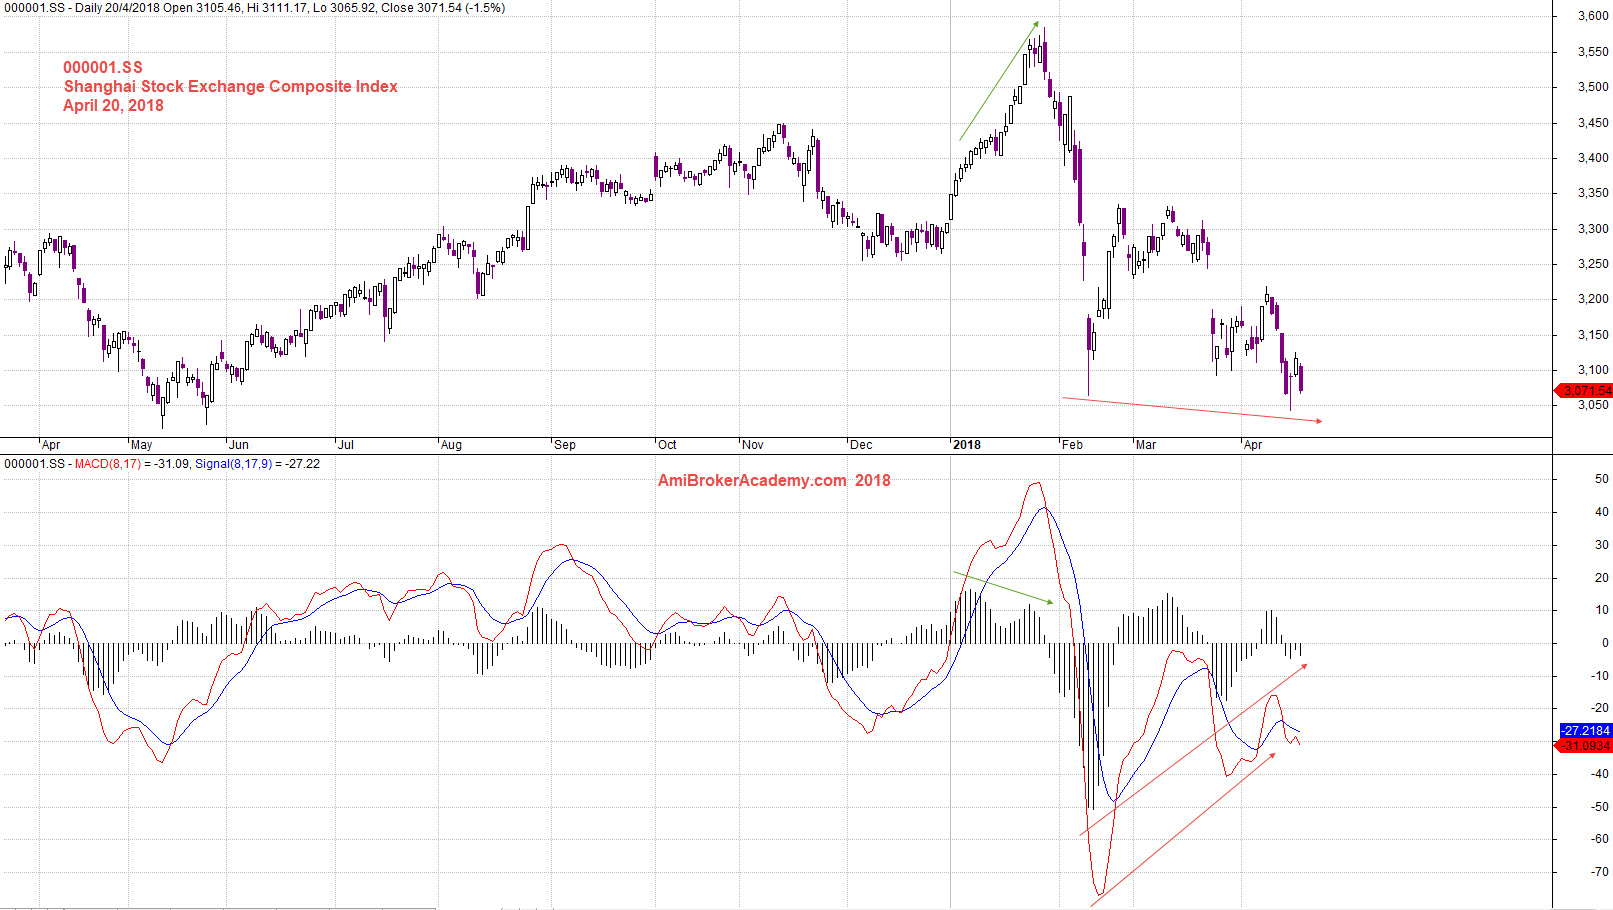
April 20, 2018 Shanghai Stock Exchange Composite Index and MACD
Powerful Chart Software – AmiBroker
The following chart is produced using AmiBroker charting software. It is a powerful chart software. Anything, finance ticket you could download from Yahoo! Finance you could plot them, those you are interested all in a chart, so you could analyse them.
Moses China Stock Chart Analysis
AmiBrokerAcademy.com
Disclaimer
The above result is for illustration purpose. It is not meant to be used for buy or sell decision. We do not recommend any particular stocks. If particular stocks of such are mentioned, they are meant as demonstration of Amibroker as a powerful charting software and MACD. Amibroker can program to scan the stocks for buy and sell signals.
These are script generated signals. Not all scan results are shown here. The MACD signal should use with price action. Users must understand what MACD and price action are all about before using them. If necessary you should attend a course to learn more on Technical Analysis (TA) and Moving Average Convergence Divergence, MACD.
Once again, the website does not guarantee any results or investment return based on the information and instruction you have read here. It should be used as learning aids only and if you decide to trade real money, all trading decision should be your own.