28 May, 2018
Sometime back in April this year, we have the opportunity to study BCSBarclays charting. But it was a very special learning, as we take a snapshot of the bank back in 1987, Black Monday, October 19.
If you like, you could search the site for the chart stories.
US Stock Chart Analysis
Barclays PLC BCS and Support Resistance
Picture worth a thousand words, see chart on Barclays. From the chart, you can see or feel 2016 is the most volatile for 206 to 2018. Of course, 2018 only go through five months.
Manage your risk!
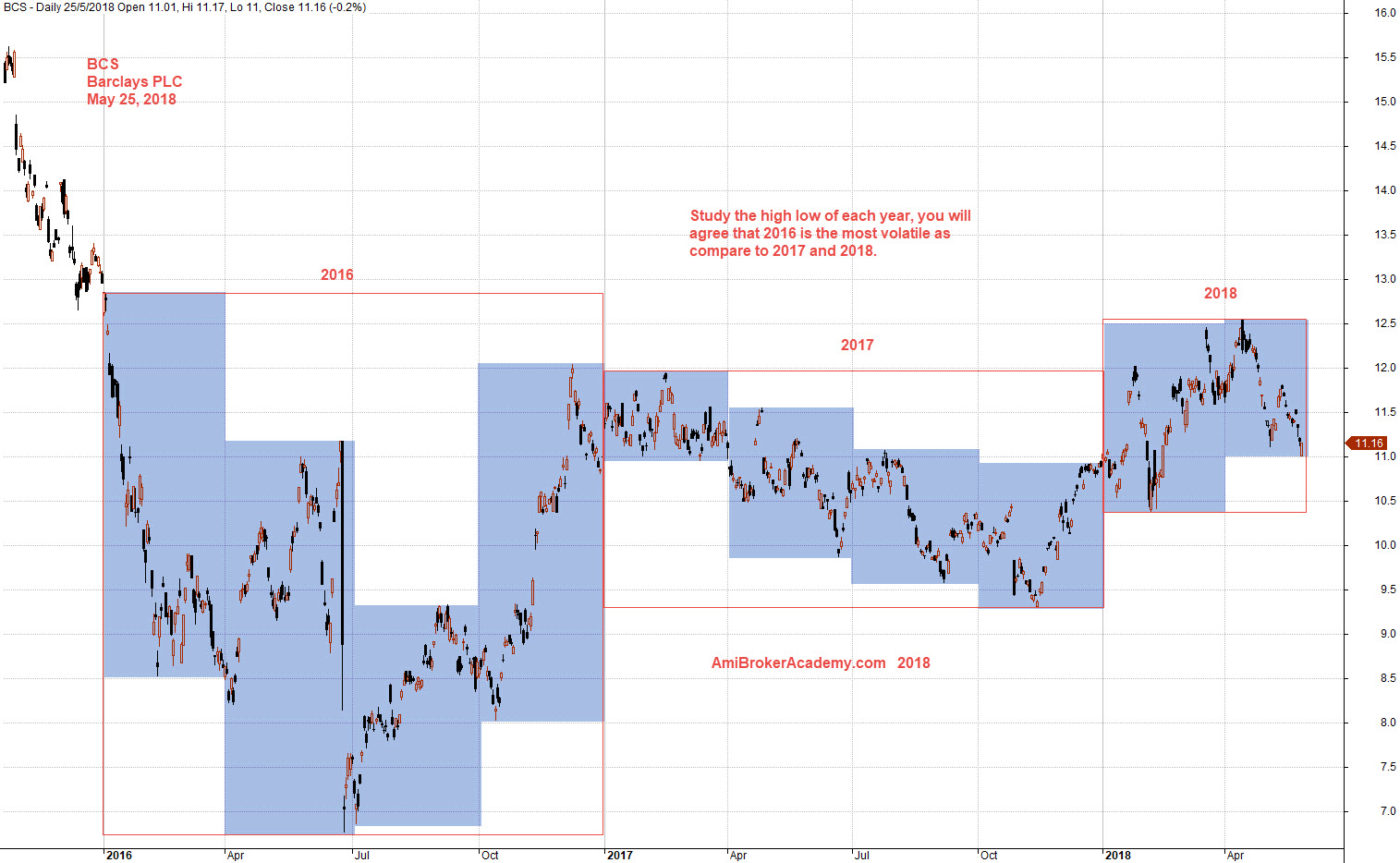
May 25, 2018 Barclays and Support Resistance
Moses US Stock Chart Analysis
AmiBrokerAcademy.com
Disclaimer
The above result is for illustration purpose. It is not meant to be used for buy or sell decision. We do not recommend any particular stocks. If particular stocks of such are mentioned, they are meant as demonstration of Amibroker as a powerful charting software and MACD. Amibroker can program to scan the stocks for buy and sell signals.
These are script generated signals. Not all scan results are shown here. The MACD signal should use with price action. Users must understand what MACD and price action are all about before using them. If necessary you should attend a course to learn more on Technical Analysis (TA) and Moving Average Convergence Divergence, MACD.
Once again, the website does not guarantee any results or investment return based on the information and instruction you have read here. It should be used as learning aids only and if you decide to trade real money, all trading decision should be your own.