19 March 2021
Welcome!
Welcome to AmiBroker Academy dot com, amibrokeracademy.com.
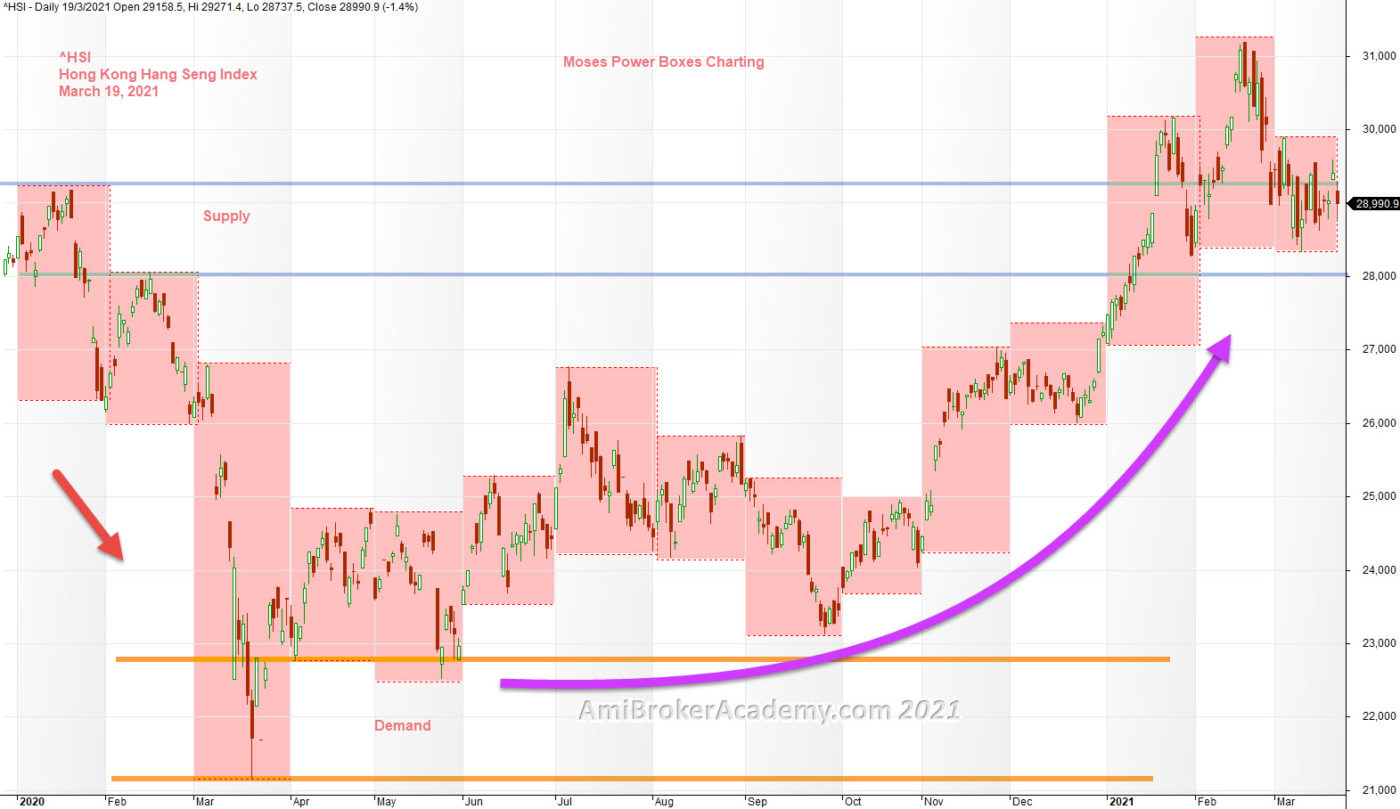
^HSI | Hong Kong Hang Seng Index Price Action and Supply Demand Charting
Study Hong Kong Hang Seng Index Price Action and Supply Demand Stock Charting. Price Action goes high to low, and rebonce to test the last January high and breakout. Price Action fail after 31,000 level. See the supply and demand situation. The demand was sharply drop in the start of 2020, but slowly climb back up. It was over supply at the start of 2020.
Is the demand continue in 2021? Will see.
Manage your trade risk.
Moses Free Stock Charting
Free China Stock Charting
Official AmiBrokerAcademy.com Charting
Disclaimer
The above result is for illustration purpose. It is not meant to be used for buy or sell decision. We do not recommend any particular stocks. If particular stocks of such are mentioned, they are meant as demonstration of Amibroker as a powerful charting software and MACD. Amibroker can program to scan the stocks for buy and sell signals.
These are script generated signals. Not all scan results are shown here. The MACD signal should use with price action. Users must understand what MACD and price action are all about before using them. If necessary you should attend a course to learn more on Technical Analysis (TA) and Moving Average Convergence Divergence, MACD.
Once again, the website does not guarantee any results or investment return based on the information and instruction you have read here. It should be used as learning aids only and if you decide to trade real money, all trading decision should be your own.
We learn from many past and present great traders. Kudo to these master.