3 March, 2019
Thanks for visit the site here. Hope you find the read interesting.
Think think got more things.
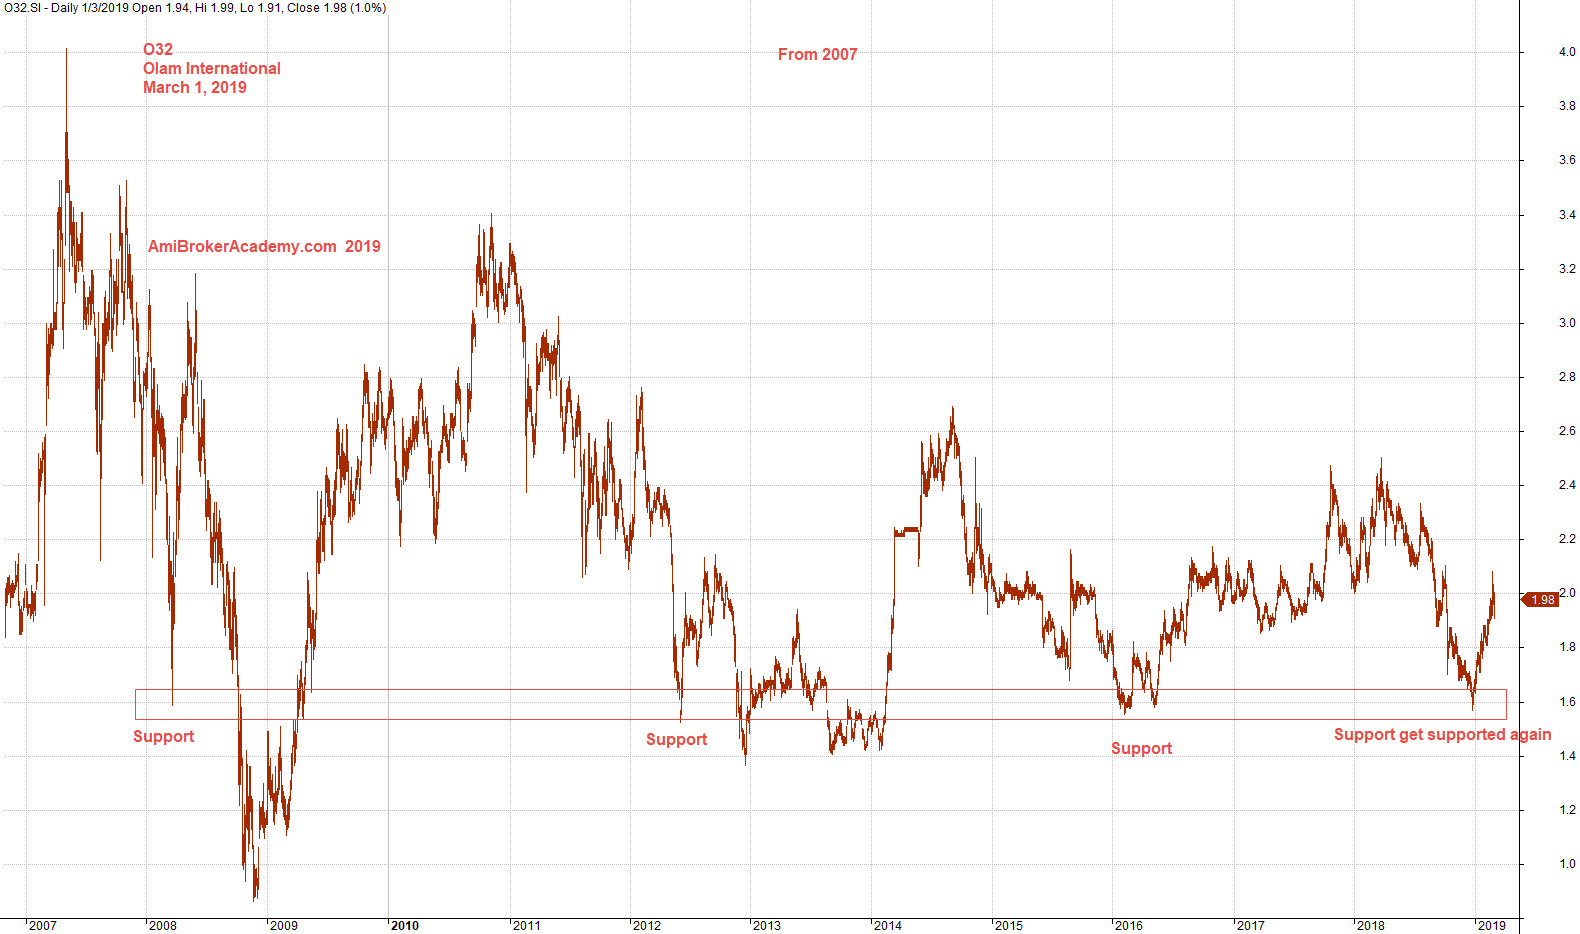
O32 Olam International Stock Charting
Study Olam stock chart.
See chart, can you see the key support. Those that below support were trapped. The key support has shown that support get supported again.
Picture worth a thousand words.
These stock price for Olam was way back to 2007, was through the Great Recession of 2008-2009.
Do you notice that the price action keep going lower, mean lower high. The price can never return to before their glory at least on this chart.
Do you think the situation will change? I don’t know. But with the world economy getting more channeling. Many of the new tariff policy created to cover or protect the back. There are more uncertainty for doing business. If you are not there you are not there. Even if you are there, you may fail to sustain your current level. See Apple products are not as attractive as in the past, as the demand is reduce. Besides that the production of the product are also channel. They are ask to move back to America to produce the products. So, think. Everyday is different. Do not assume. The lucky thing, Olam find a support, a strong support, see chart.
Trade with eyes open.
Moses Stock Chart Analysis
AmiBrokerAcademy.com
Disclaimer
The above result is for illustration purpose. It is not meant to be used for buy or sell decision. We do not recommend any particular stocks. If particular stocks of such are mentioned, they are meant as demonstration of Amibroker as a powerful charting software and MACD. Amibroker can program to scan the stocks for buy and sell signals.
These are script generated signals. Not all scan results are shown here. The MACD signal should use with price action. Users must understand what MACD and price action are all about before using them. If necessary you should attend a course to learn more on Technical Analysis (TA) and Moving Average Convergence Divergence, MACD.
Once again, the website does not guarantee any results or investment return based on the information and instruction you have read here. It should be used as learning aids only and if you decide to trade real money, all trading decision should be your own.