16 December, 2018
Thanks for visiting the site.
^DJI Dow Jones Industrial Average Index Daily Chart
Buy Low Sell High
Equal to Buy Support Sell Resistance
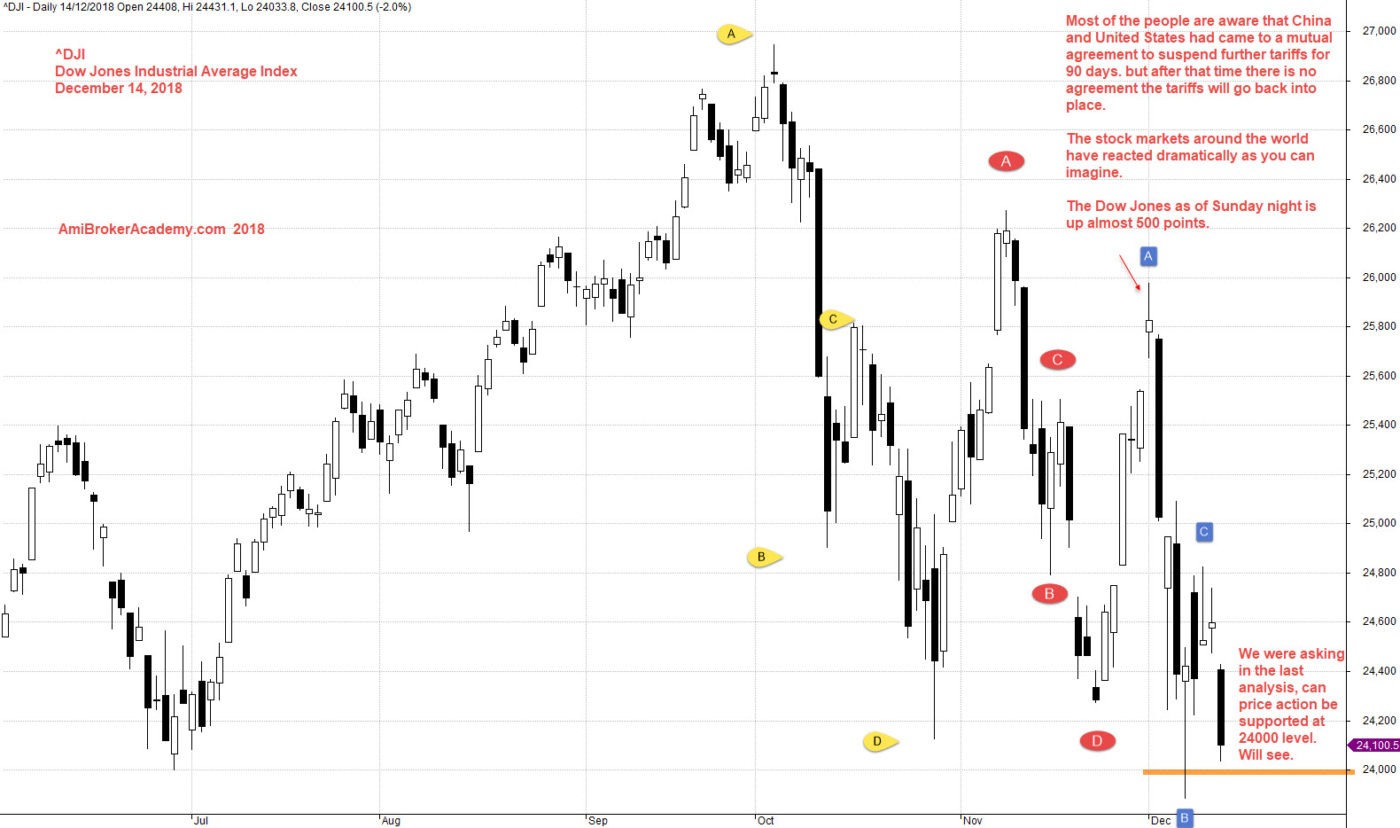
Market has topping. See chart.
Most of the people are aware that China and United States had came to a mutual agreement to suspend further tariffs for 90 days. but after that time there is still no agreement the tariffs will go back into place.
The stock markets around the world have reacted dramatically as you can imagine, a gap up.
The Dow Jones was up nearly 500 points.
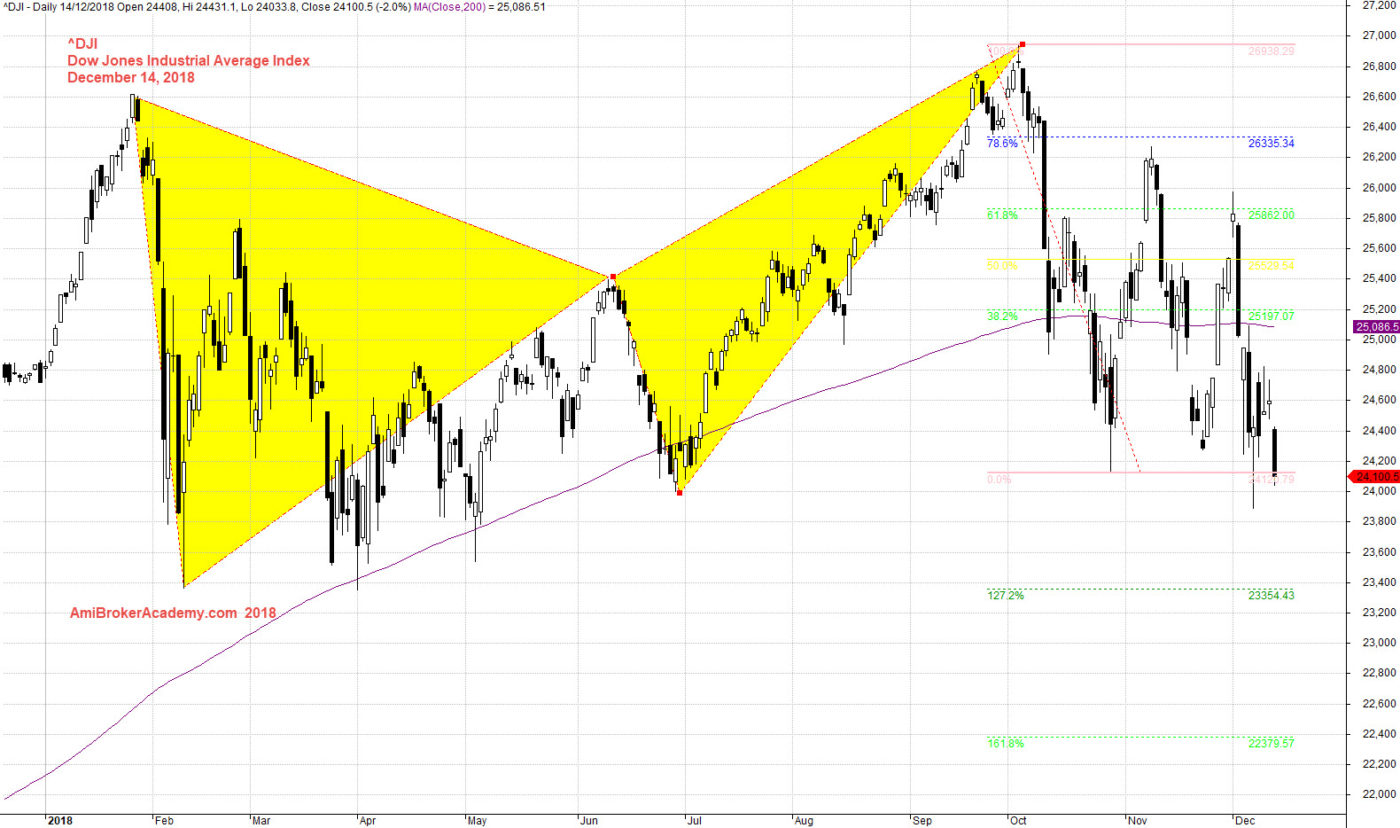
See chart, we could easily identify H M Gartley pattern.
If the down move continue, the price action will breakout below 24000 level. Trade with eyes open.
if you can see the full chart, “press Ctrl and -” to zoom out and see the entire chart.
Add Fibonacci Retracement, see chart.
Moses US Stock Chart Analysis
AmiBrokerAcademy.com
Disclaimer
The above result is for illustration purpose. It is not meant to be used for buy or sell decision. We do not recommend any particular stocks. If particular stocks of such are mentioned, they are meant as demonstration of Amibroker as a powerful charting software and MACD. Amibroker can program to scan the stocks for buy and sell signals.
These are script generated signals. Not all scan results are shown here. The MACD signal should use with price action. Users must understand what MACD and price action are all about before using them. If necessary you should attend a course to learn more on Technical Analysis (TA) and Moving Average Convergence Divergence, MACD.
Once again, the website does not guarantee any results or investment return based on the information and instruction you have read here. It should be used as learning aids only and if you decide to trade real money, all trading decision should be your own.