Straits Times Index Update, Can the STI break the 3000 points level and once for all?
Welcome to AmiBrokerAcademy.com Moses’s Stock Corner. Straits Times Index Analysis, last few weeks with the uncertainty Singapore stock market benchmark Straits Times Index, STI has been hovered around 3000 points’ level.
There were a few AB = CD chart patterns, or potential AB = CD to be.
Straits Times Index, STI Daily Chart and AB = CD
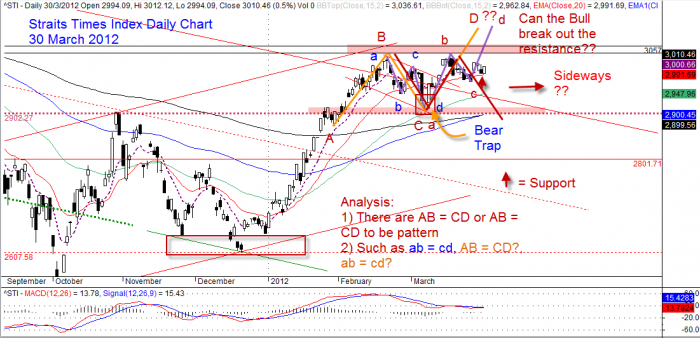
Straits Times Index Daily AB = CD March 30, 2012
Straits Times Index, STI Daily Chart and AB = CD plus Bearish Flag
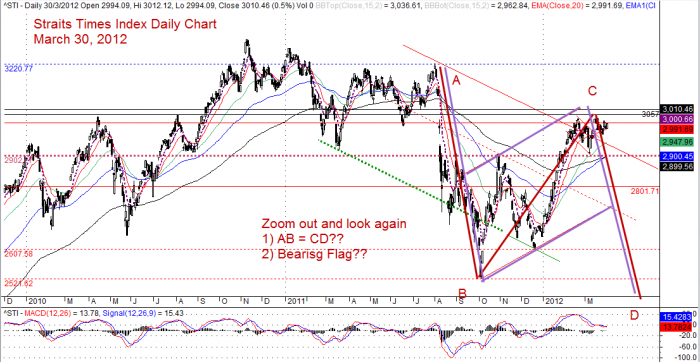
Straits Times Index Daily Bearish Flag plus AB = CD
Moses, April 1, 2012
DSICLAIMER
Information provided here is of the nature of a general comment only and no intend to be specific for trading advice. It has prepared without regard to any particular investment objectives, financial situation or needs. Information should not be considered as an offer or enticement to buy, sell or trade.
You should seek advice from your broker, or licensed investment advisor, before taking any action.
Straits Times Index, STI Update, STI Broke the 3000 points critical level. In the last update, I highlighted that for short term it is a bullish flag chart pattern but long term it may be a bearish flag chart pattern. I suggest that trade with caution. So, what’s next? Will the last candlestick turn into an evening start? Welcome to Moses’s Stock Analysis Corner at AmiBrokeracademy.com.