Moses’s Singapore stock analysis. Golden Agri Resources Update, Hit 1 in Four Months?
The chart may look complicated. Take your time to digest what’s commented on the chart. Welcome to Moses’s Free Stock Corner Stock Analysis at AmiBrokerAcademy.com. You are here because you want to know why the stock moves or will it move in the near future.
This stock did not synchronize with STI. When Straits Times Index was down, this stock price action was still trusting up.
As mentioned in the previous posting that the price action 0.74 may be supported by the dynamic support formed by the two moving averages, 20 and 50 EMA. It did not disappoint us! The price action has back pulled number of times but get supported by a newly added 9 EMA.
The price action has finally break 0.8. The highest was 0.805. After that the price action start to range between 0.79 and 0.8. Can the price break a higher high or it will range for sometimes to cumulate enough energy? Will see.
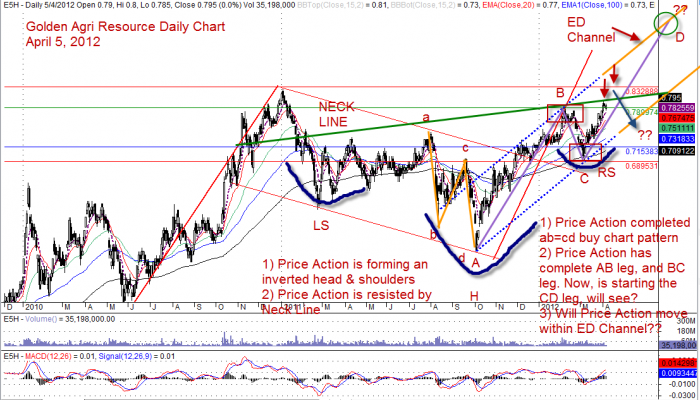
You can see the price action has completed an inverted head and shoulders chart pattern and waiting for the right shoulder to break the neck line.
When you take a closer look, you could see a very vivid famous Gartley AB = CD buy chart pattern. The price action completed the pattern and rebounced sharply after 0.59. Another Gartley AB = CD sell chart pattern is evolving. Now has completed the AB and BC legs. Now the price action is travel north to complete the CD leg. When can the leg be completed? May be three to four months from now and finish at the price action near 1. By then the price action will meet the other side of the channel too.
ED channel, equal distance channel is still valid. Can the price hits the other side of the channel? Will see.
Technical analysis is great, is fun. It analyses the market and predict where the price action might travel. But there is uncertainty. The market is live; there are many factors that influence the market. There are resistance to stop the price action from travelling north. Trade with caution.
See other posts on Golden Agri on this website.
Golden Agri Resources Daily Chart, April 5, 2012
Golden Agri Resources Daily Chart, ED Channel, Gartley AB=CD, Inverted Head & Shoulders
By Moses April 9, 2012
DSICLAIMER
Information provided here is of the nature of a general comment only and no intend to be specific for trading advice. It has prepared without regard to any particular investment objectives, financial situation or needs. Information should not be considered as an offer or enticement to buy, sell or trade.
You should seek advice from your broker, or licensed investment advisor, before taking any action.
Once again, the website does not guarantee any results or investment return based on the information and instruction you have read here. It should be used as learning aids only and if you decide to trade real money, all trading decision should be your own.