Straits Times Index Update, Broken Critical 3000 Points Level
Welcome to AmiBrokerAcademy.com Moses’s Stock Corner. With the good news influence the market. The Asia stock market emotion was high and most of the markets were good. Once again yesterday Singapore stock market benchmark Straits Times Index, STI has break the 3000 points level again, bounced off the strong support of the dynamic support given by first 50 days EMA then followed by the 20 days EMA.
In the last update, I highlighted that for short term it is a bullish flag chart pattern but long term it may be a bearish flag chart pattern. To read the post, check the posting out; Straits Times Index Update, Bullish Flag Chart Pattern? Bearish Flag Chart Pattern?
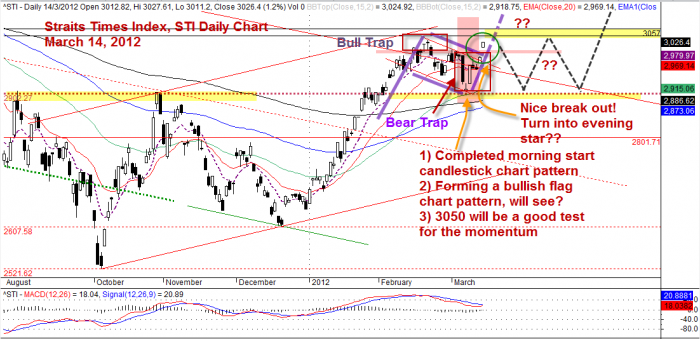
Many who have shorted the STI may get stopped out or trapped by the bear trap if they do overlook the critical level of 2900 and have not taken some profit. It is always so tricky that after the bull trap and now comes the bear trap. What will happen next?
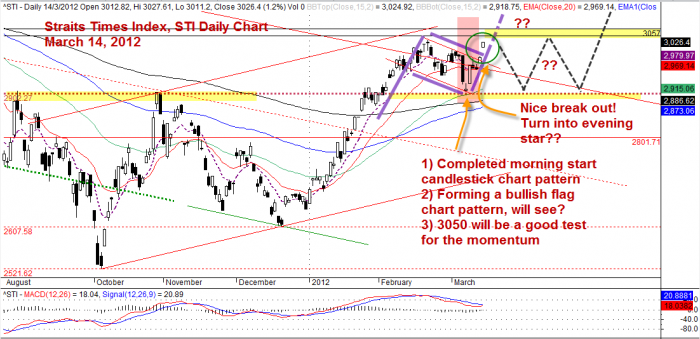
Looking at the chart, you will easily find a nice morning start candlestick chart pattern formed and completed at the critical level 2900 points. A critical level is such as resistance turned support. Now will the yesterday candlestick become an evening star? Will see?
The pattern will only be obvious when it is near the completion. Now it is just at beginning of forming a pattern. What pattern? Any pattern. May be bullish flag chart pattern? Or evening start candlestick pattern? But the truth is it has broken the 3000 points critical level again, in less than 16 days.
Trade with caution!
Straits Times Index, STI Daily Chart
Bull Trap, Bear Trap, Bullish Flag Chart Pattern, Morning Star, and Evening Star are all in one chart. Either the pattern has completed or at the process of forming.
Straits Times Index Daily Chart, Bull and Bear Traps March 14, 2012
Straits Times Index Daily March 14, 2012
Thanks for visiting the site, you are here because you want to know why the stock moves.
By Moses, March 15, 2012
DSICLAIMER
Information provided here is of the nature of a general comment only and no intend to be specific for trading advice. It has prepared without regard to any particular investment objectives, financial situation or needs. Information should not be considered as an offer or enticement to buy, sell or trade.
You should seek advice from your broker, or licensed investment advisor, before taking any action.