Straits Times Index Update, Bullish Flag Chart Pattern? Bearish Flag Chart Pattern?
Welcome to AmiBrokerAcademy.com Moses’s Stock Corner. This week Singapore stock market benchmark Straits Times Index, STI has moved south from 2998.12 points high on Monday, March 5 2012 to low of 2906.58 on Wednesday March 7 2012.
STI was resisted at 2998.12 points level, support turn resistance and STI began to move south. On Wednesday the situation turned around, STI has stopped moving south at the 2900 level; the critical level; resistance turn support. The index has since bounced back up to travel north. Once again to prepare to challenge the 3000 points level again. Will the index succeed in breaking up 3000 points level?
Every now and then it is a good idea to stand back from the market and take a wider look at market performance or behaviour. Some suggest that for EOD chart, 240 days will properly give us a good sample of the market trend.
If you gaze the chart you will see a bullish flag chart pattern. But when you move back and gaze again at the chart, you may see a bearish flag chart pattern. So, is bullish flag chart pattern or bearish flag chart pattern correct? Which is which?
Short term, it is a bullish flag chart pattern. Long term, it is a bearish flag chart pattern.
As said, there is possible support to slow down the index from moving south. See the number of layers of defense to slow the index from moving south. See the previous posting for details.
Trade with caution!
Straits Times Index, STI Daily Bullish Chart Pattern
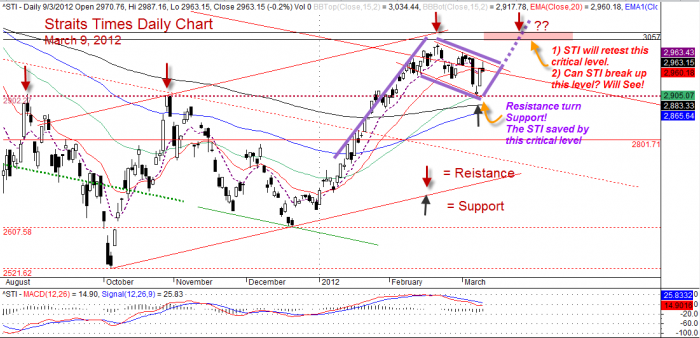
Straits Times Index Daily, STI Bullish Flag, March 9, 2012
Straits Times Index, STI Daily Bearish Chart Pattern
When you step back and gaze at the chart again.
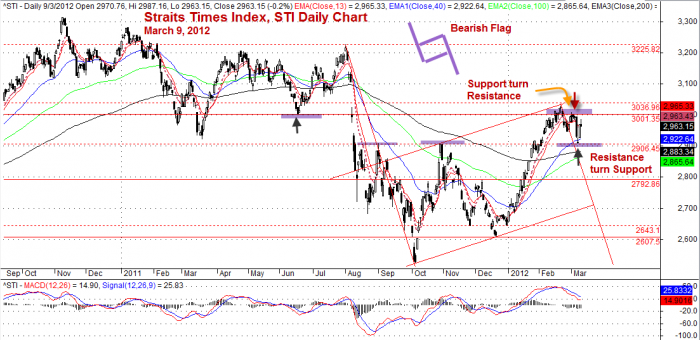
Straits Times Index, STI Daily Bearish Flag March 9, 2012
Moses, March 11, 2012
DSICLAIMER
Information provided here is of the nature of a general comment only and no intend to be specific for trading advice. It has prepared without regard to any particular investment objectives, financial situation or needs. Information should not be considered as an offer or enticement to buy, sell or trade.
You should seek advice from your broker, or licensed investment advisor, before taking any action.