March 10, 2018
Powerful Chart Software – AmiBroker
The following chart is produced using AmiBroker charting software. It is a powerful chart software. You plot the stocks you are interested all in one chart, as long as you still could read them. See chart below. Thereafter slowly climb up, step by step.
Singapore Stock Analysis
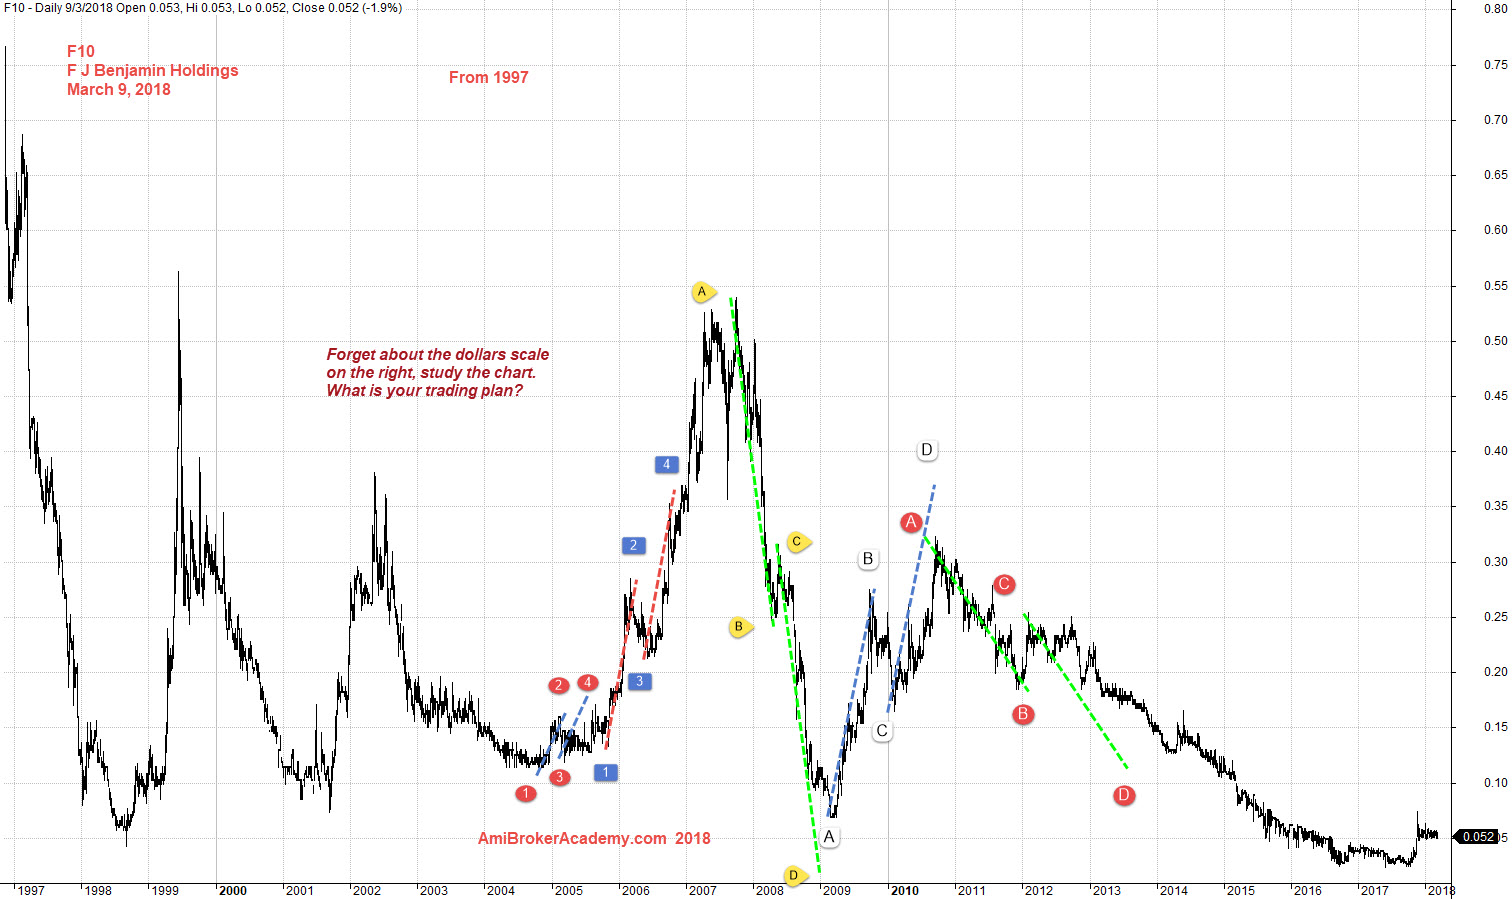
Stock Code:F10 – F J Benjamin Holdings Charting
At one time, any IPO stocks when you manage to buy at the issuing time, you are laughing to the bank. But may be not this one. May be IPO at the wrong time, when the recession was round the corner.
See the stock price, went into a deep first, pull up then deep again. After a few try, the market got tire too.
The analysis is just read out loud from the data.
We often like to post stock chart from IPO, such as Alibaba BABA is just one of them. See the BABA posting for more.
Manage your risk!
March 9, 2018 FJ Benjamin Holdings and ABCD Patterns
Moses Singapore Stock Analysis
AmiBrokerAcademy.com
Disclaimer
The above result is for illustration purpose. It is not meant to be used for buy or sell decision. We do not recommend any particular stocks. If particular stocks of such are mentioned, they are meant as demonstration of Amibroker as a powerful charting software and MACD. Amibroker can program to scan the stocks for buy and sell signals.
These are script generated signals. Not all scan results are shown here. The MACD signal should use with price action. Users must understand what MACD and price action are all about before using them. If necessary you should attend a course to learn more on Technical Analysis (TA) and Moving Average Convergence Divergence, MACD.
Once again, the website does not guarantee any results or investment return based on the information and instruction you have read here. It should be used as learning aids only and if you decide to trade real money, all trading decision should be your own.