February 25, 2018
Powerful Chart Software – AmiBroker
The following chart is produced using AmiBroker charting software. It is a powerful chart software. You plot the stocks you are interested all in one chart, as long as you still could read them. See chart below. Thereafter slowly climb up, step by step.
Singapore Stock Analysis
STI Straits Times Index and Fibonacci Retracement
Study chart for more, picture worth a thousand words the Fibo Retracement September Low to January High, and the price action pullback.
Manage your risk!
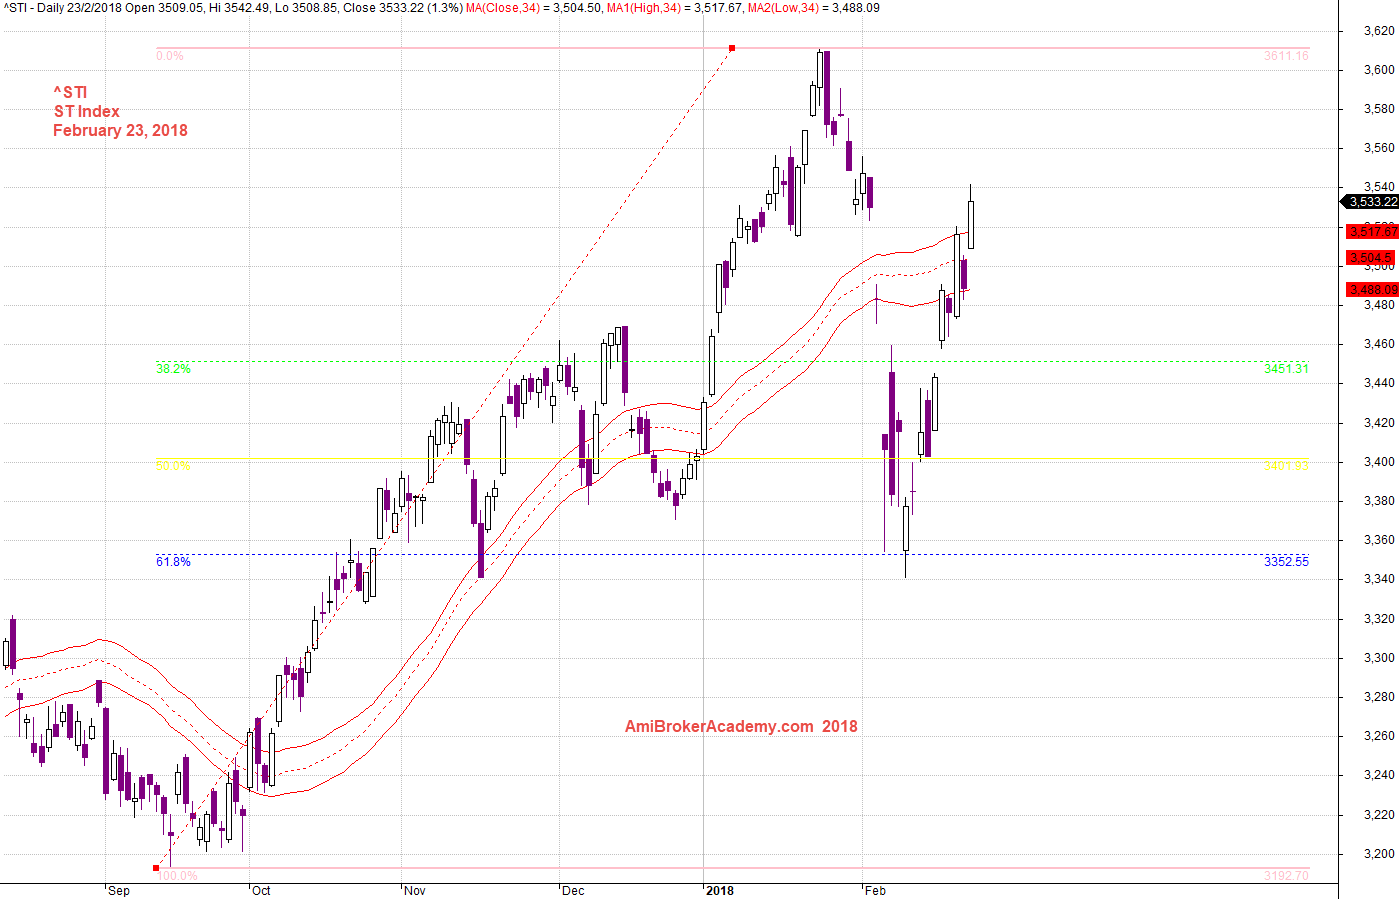
20180223 STI ST Index and Fibo Retracement Swing Low to High
STI Straits Times Index and Fibonacci Retracement From High to Low
See chart for more.
Manage your risk!
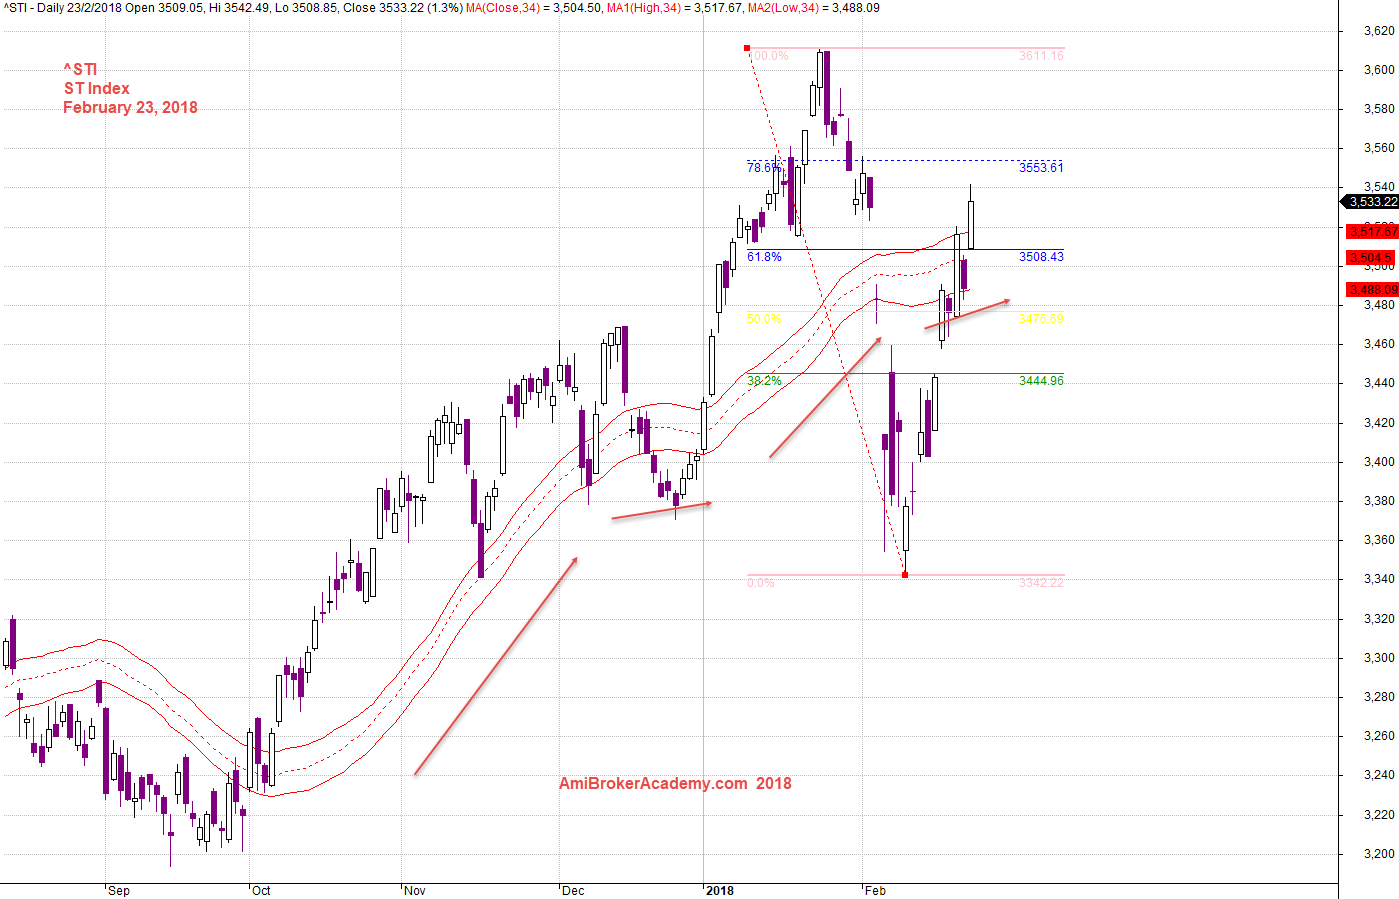
20180223 STI ST Index and Fibo Retracement Swin High to Low
^STI Straits Times Index and Fibonacci Extension From Low to High
See chart for more.
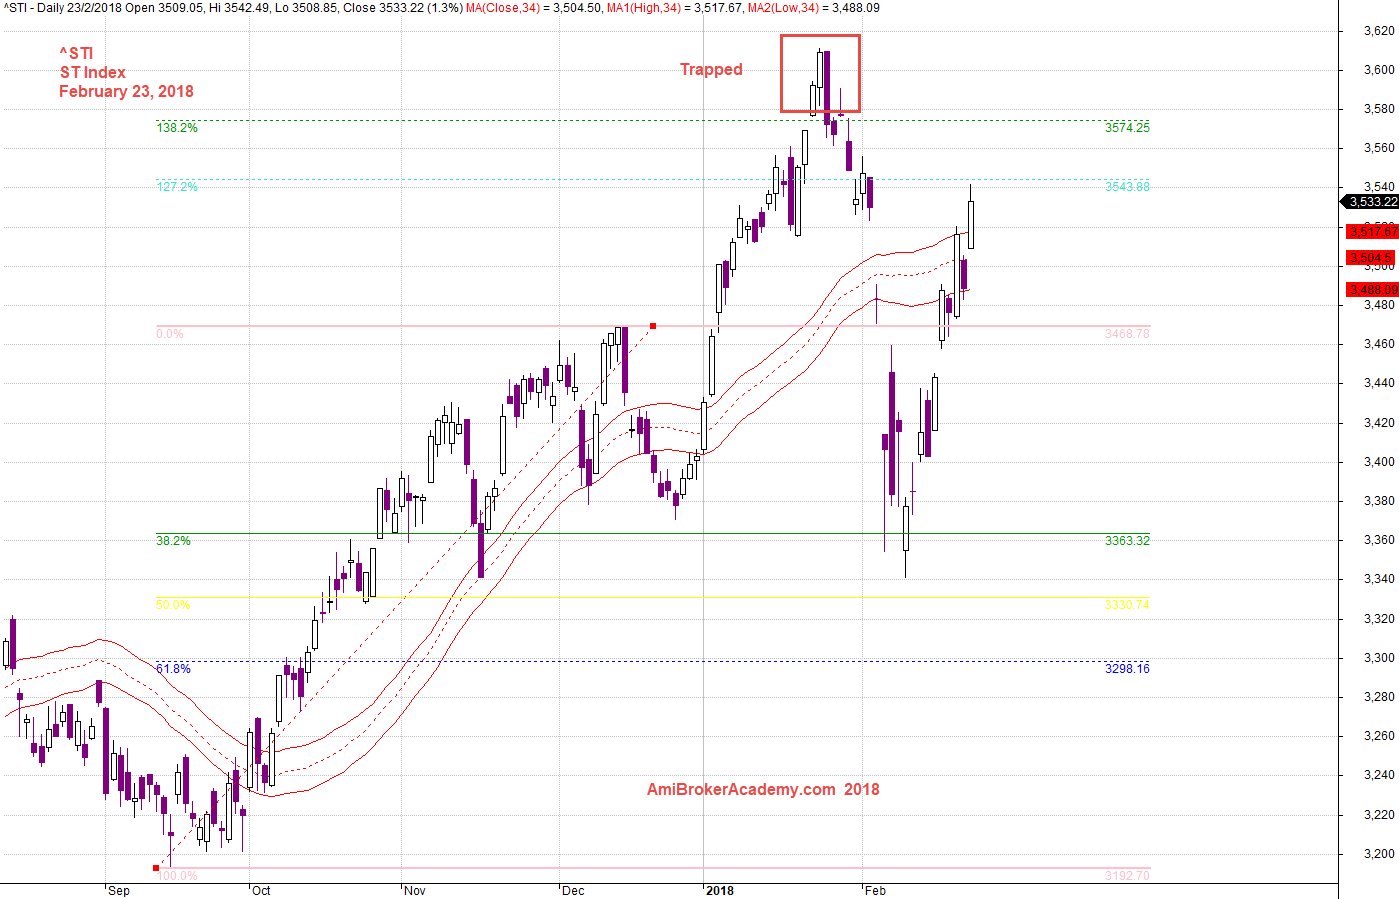
20180223 STI ST Index and Fibo Extension Swin Low to High
Moses
AmiBrokerAcademy.com
Disclaimer
The above result is for illustration purpose. It is not meant to be used for buy or sell decision. We do not recommend any particular stocks. If particular stocks of such are mentioned, they are meant as demonstration of Amibroker as a powerful charting software and MACD. Amibroker can program to scan the stocks for buy and sell signals.
These are script generated signals. Not all scan results are shown here. The MACD signal should use with price action. Users must understand what MACD and price action are all about before using them. If necessary you should attend a course to learn more on Technical Analysis (TA) and Moving Average Convergence Divergence, MACD.
Once again, the website does not guarantee any results or investment return based on the information and instruction you have read here. It should be used as learning aids only and if you decide to trade real money, all trading decision should be your own.