March 8, 2018
Powerful Chart Software – AmiBroker
The following chart is produced using AmiBroker charting software. It is a powerful chart software. You plot the stocks you are interested all in one chart, as long as you still could read them. See chart below. Thereafter slowly climb up, step by step.
Singapore Stock Analysis
STI Straits Times Index Chart Analysis
Study chart, typical STI chart. Look left, think right. Think think got more things, we see 2015 after the the strong bulls, push the STI all the way to the top, and suddenly let go. The price action since then continue to drift lower, and lower. Those whom was rush in the support the bulls, all got caught and trapped. The price action continue to drift down to the end of 2015. Starting from the low, below 2600, STI continue to work hard to push STI higher for two years, 2016, and 2017.
STI drifted back at December 2017, but the new bulls come in to push STI higher. It was nice to see STI breakout even higher then 2015 high. But again the bull suddenly let go again, STI falls below 2013 high. Bulls push it up again, but this time it is lower than the last high. Now you could easily see a lower high. Is the trend reversing? Will see.
Do your home work and analysis? Don’t just agree on any comment and remarks.
Manage your risk!
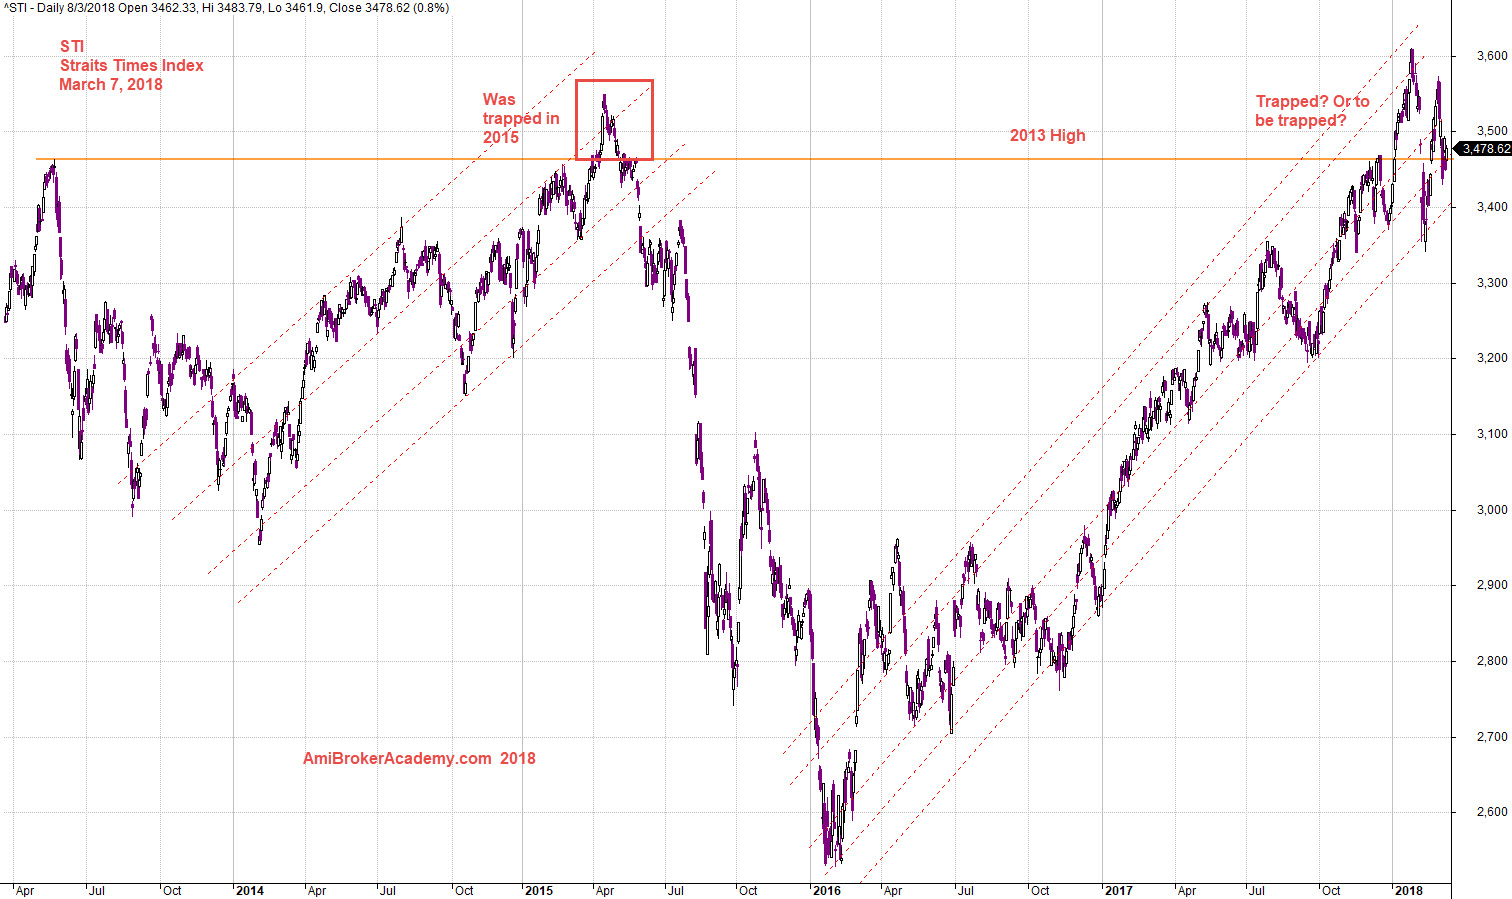
March 7, 2018 STI Straits Times Index Typical Charting (the day not close)
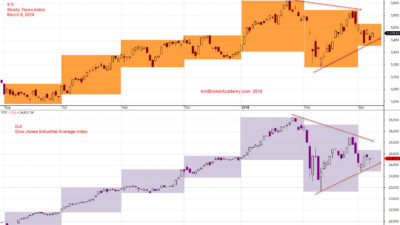
20180307 STI Straits Times Index and Dow Correlation
STI Straits Times Index Benchmark US Key Index Dow
See chart for more. We benchmark STI with the US key Index, Dow, Dow Jones Industrial Average Index. Besides also checkout the month high and Low on both Indexes. Manage your risk.
Moses Singapore Stock Analysis
AmiBrokerAcademy.com
Disclaimer
The above result is for illustration purpose. It is not meant to be used for buy or sell decision. We do not recommend any particular stocks. If particular stocks of such are mentioned, they are meant as demonstration of Amibroker as a powerful charting software and MACD. Amibroker can program to scan the stocks for buy and sell signals.
These are script generated signals. Not all scan results are shown here. The MACD signal should use with price action. Users must understand what MACD and price action are all about before using them. If necessary you should attend a course to learn more on Technical Analysis (TA) and Moving Average Convergence Divergence, MACD.
Once again, the website does not guarantee any results or investment return based on the information and instruction you have read here. It should be used as learning aids only and if you decide to trade real money, all trading decision should be your own.