June 25, 2018
In our last STI analysis, we see a head and shoulders forming. The pattern did not fail and now completed.
Singapore Stock Stories
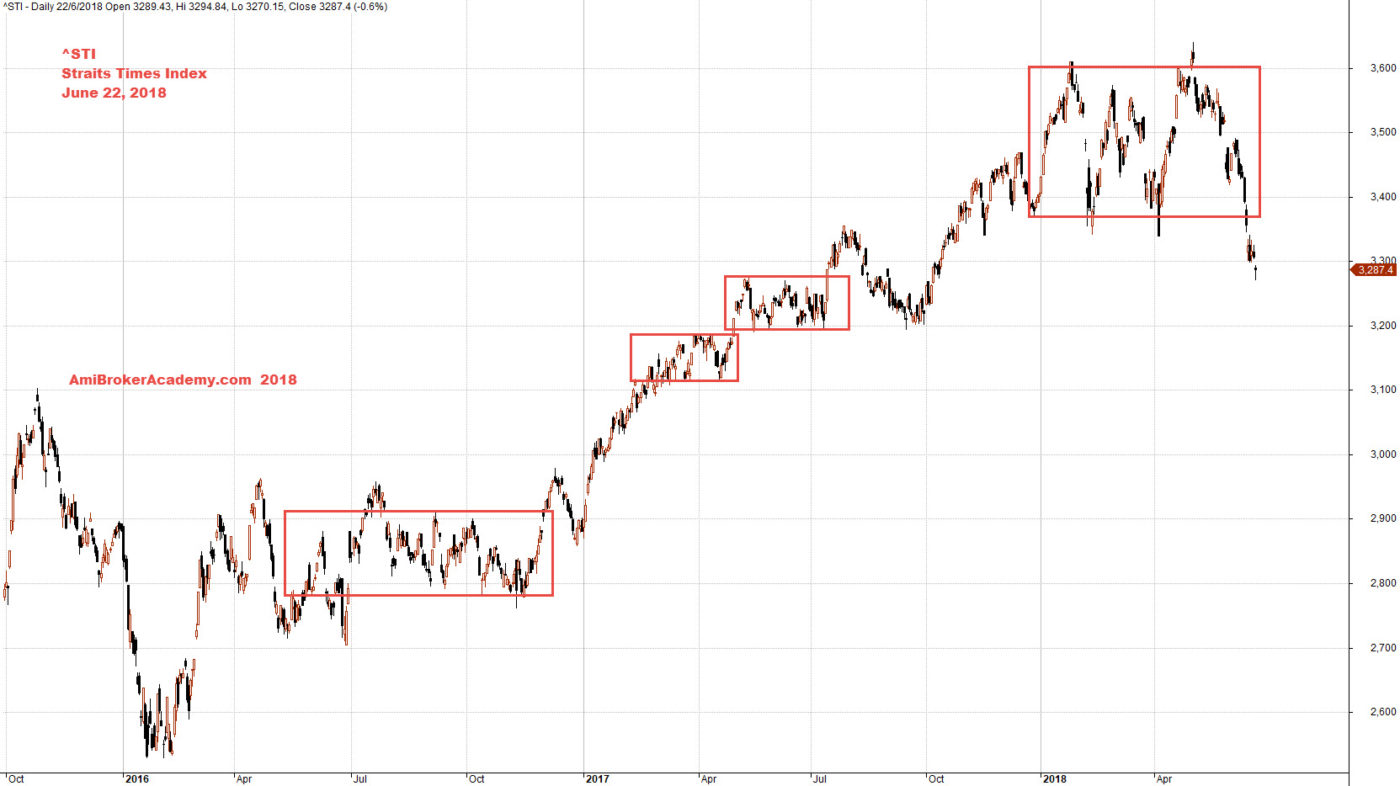
June 22, 2018 The Straits Times Index and Levels
STI The Straits Times Index and Levels
See chart, picture worth a thousand words. Study STI and its levels. The Straits Times Index has breakout below 3300 level, the next defend; support logically will be 3200. And 3200 can not hold the falling knife then the next level will be 2960 as the 3100 seems weak. Trade with your eyes open.
Manage your risk.
^STI Straits Times Index Charting and Sideways
Let’s study the STI from a different view, how about looking for possible breakout. See chart, picture worth a thousand words. Manage your risk.
June 22, 2018 Straits Times Index and Sideways
^STI The Straits Times Index Charting and Zone
Picture worth a thousand words, see chart.
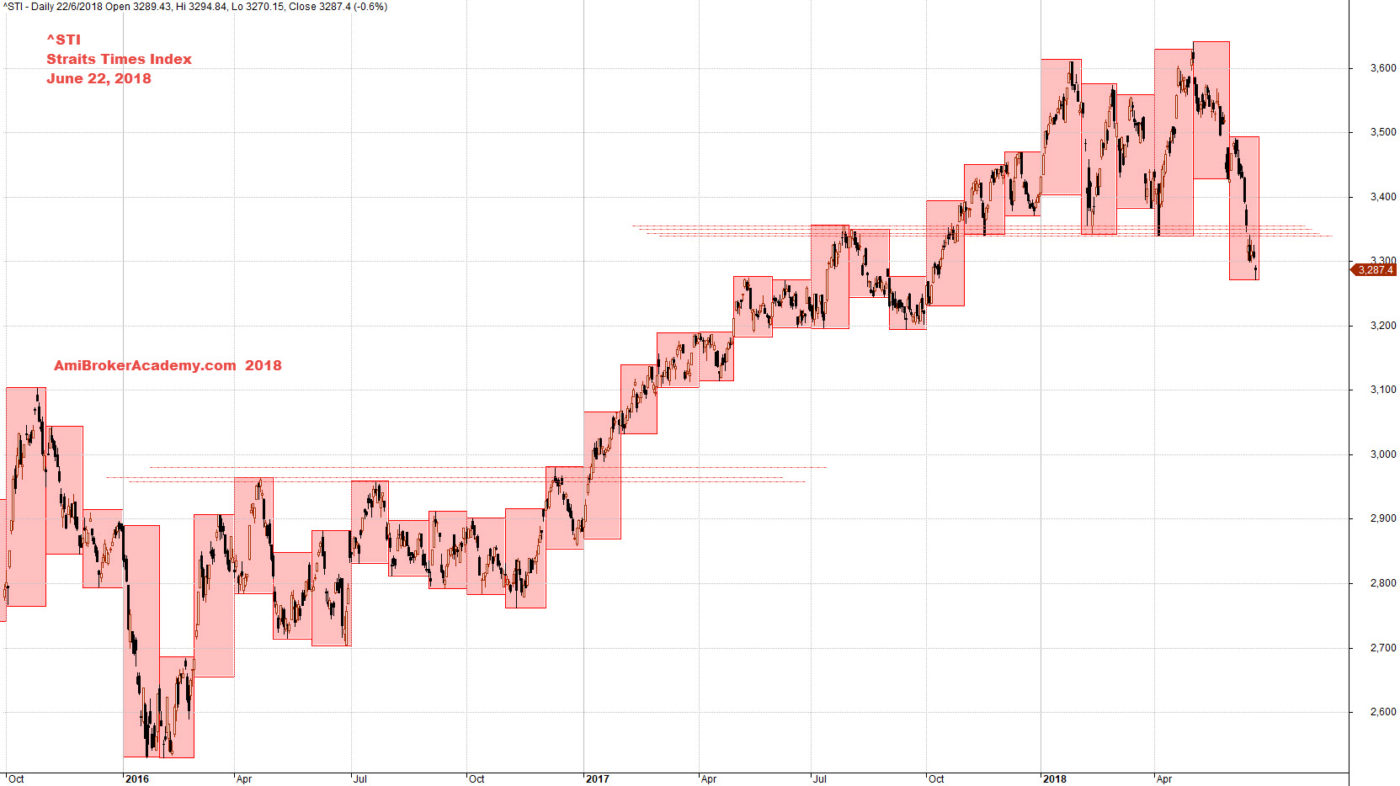
June 22, 2018 Straits Times Index and Zone
Moses
AmiBrokerAcademy.com
Disclaimer
The above result is for illustration purpose. It is not meant to be used for buy or sell decision. We do not recommend any particular stocks. If particular stocks of such are mentioned, they are meant as demonstration of Amibroker as a powerful charting software and MACD. Amibroker can program to scan the stocks for buy and sell signals.
These are script generated signals. Not all scan results are shown here. The MACD signal should use with price action. Users must understand what MACD and price action are all about before using them. If necessary you should attend a course to learn more on Technical Analysis (TA) and Moving Average Convergence Divergence, MACD.
Once again, the website does not guarantee any results or investment return based on the information and instruction you have read here. It should be used as learning aids only and if you decide to trade real money, all trading decision should be your own.