February 3, 2017
Moses Stock Trading Blog Site – AmiBrokerAcademy.com
Thank you for visiting the amibrokeracademy.com blog site. No one like us doing analysis like what you read here. Let your friend know if you enjoy what you read here.
Welcome to Moses’s US Stock Analysis @ AmiBrokerAcademy.com.
Be flexible and that certainly stands you in a good stead! Base on your own instincts and thus limited learning, you can therefore be fairly confident on your own analysis.
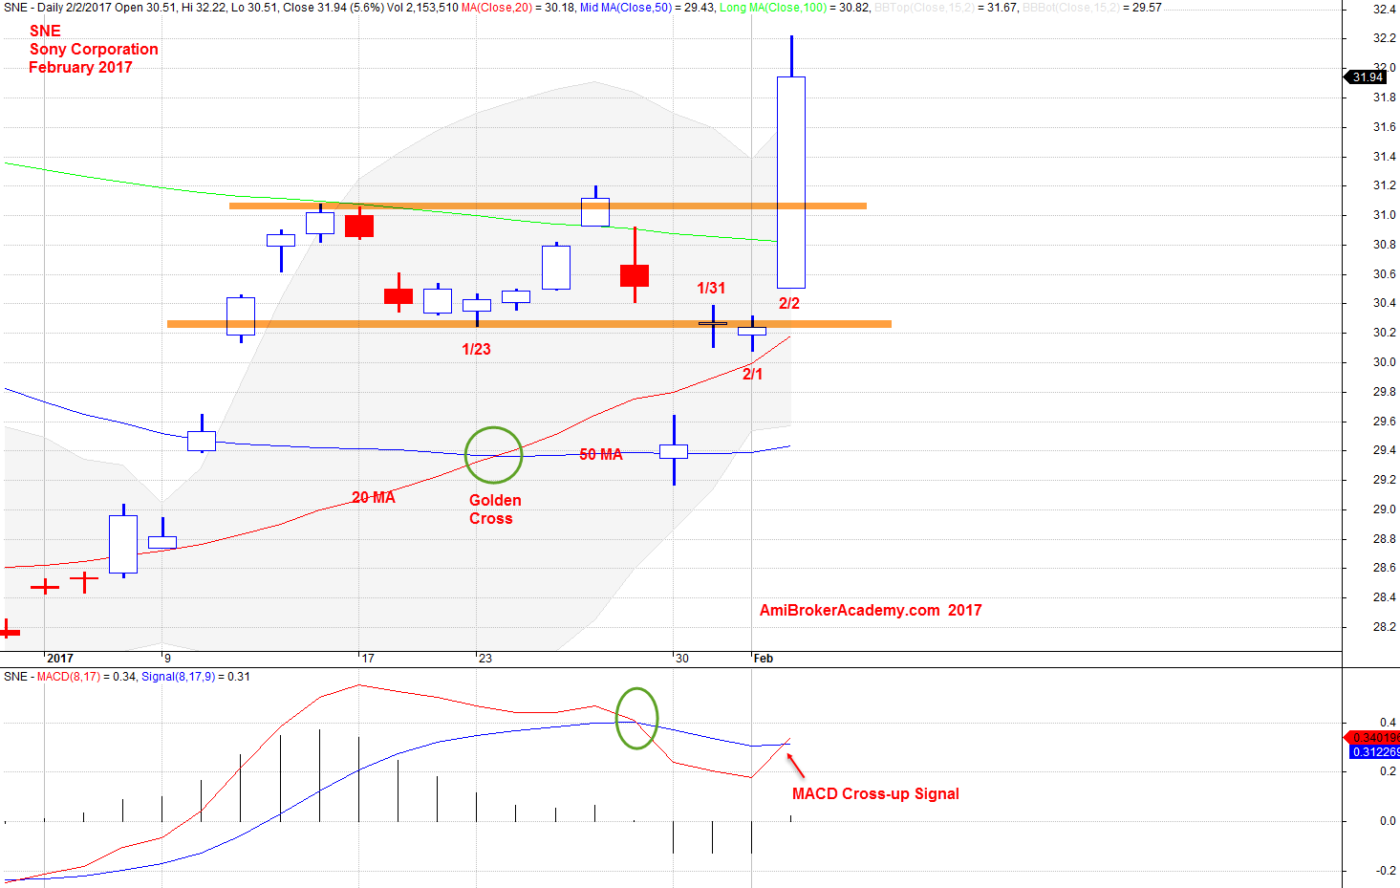
Sony Corporation 2017
Sony Corporation has a MACD cross down signal and follows a MACD Cross up signal. Stock price breakout after on 2/2. So, what’s your plan?
As long as the price action do not close below the two levels drawn, you can be sure it is bullish for now. Be aware the market is now very volatile, trade what you see.
February 3, 2017 Sony Corporation
Moses
AmiBrokerAcademy.com
Disclaimer
The above result is for illustration purpose. It is not meant to be used for buy or sell decision. We do not recommend any particular stocks. If particular stocks of such are mentioned, they are meant as demonstration of Amibroker as a powerful charting software and MACD. Amibroker can program to scan the stocks for buy and sell signals.
These are script generated signals. Not all scan results are shown here. The MACD signal should use with price action. Users must understand what MACD and price action are all about before using them. If necessary you should attend a course to learn more on Technical Analysis (TA) and Moving Average Convergence Divergence, MACD.
Once again, the website does not guarantee any results or investment return based on the information and instruction you have read here. It should be used as learning aids only and if you decide to trade real money, all trading decision should be your own.