July 7, 2017
Six Months Stock Performance
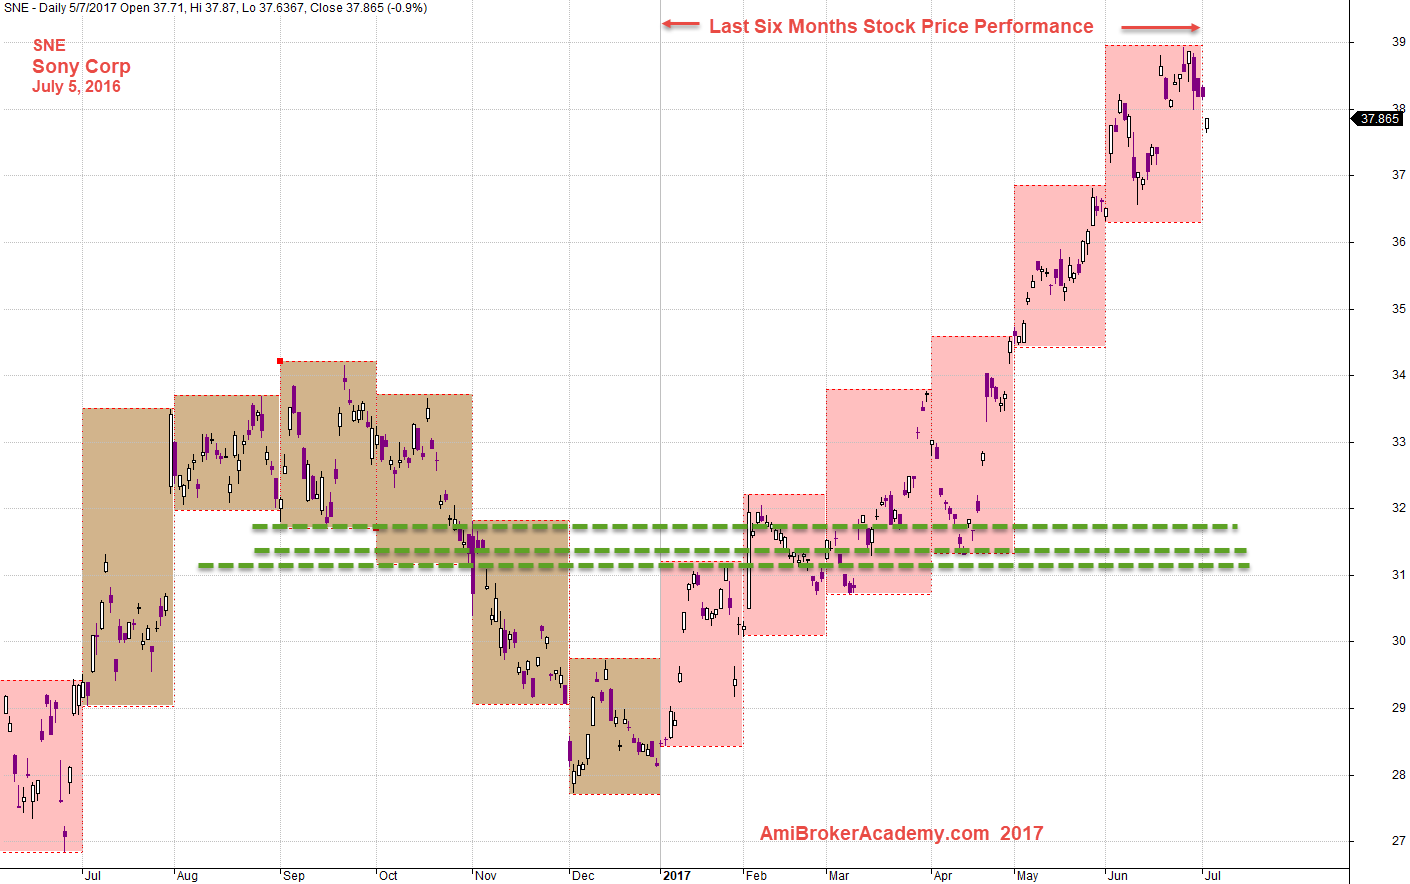
Let’s look back the last six months, as we just start to cross July.
SNE Sony Corp and First Half of 2017 Stock Price Performance
Picture worth a thousand words.
We see the price action breakout support in last November. Then price moves lower, and form a higher low in December , the price pullback (PB) to retest the resistance. The price turn support to resistance. The price retest the resistance a few times, see chart after three months. The price start to move north. Now the price is at its peak for 2017. See chart for more.
July 5, 2017 Sony Corp and Support Resistance
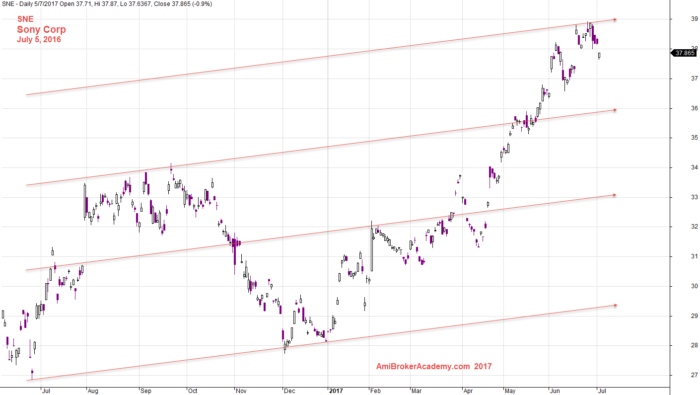
SNE Sony Corp and Channels
Connect the high or low draw a trendline, after copy the trendline and past on the other side. In other words, if copy the connection of low, then paste on the high.
Channel is a great visual tool too. The price moves from bottom left to top right. Bullish trend.
July 5, 2017 Sony Corp and Channels
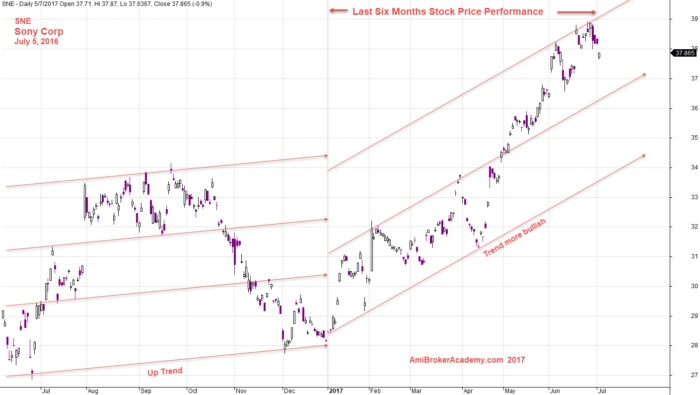
SNE Sony Corp and Six Months Channels
Check the following chart for more.
Have fun learning!
July 5, 2017 Sony Corp and Six Months Channels
SNE Sony Corp and MACD Signals
See chart for more.
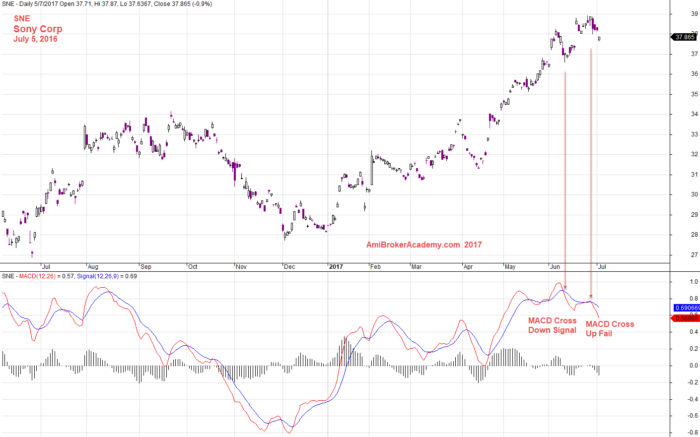
July 5, 2017 Sony Corp and MACD Signals
Risk
If you can wait, remember professional likes to wait for retracement. This will minimize the risk, as your stop loss will be smaller. So, picture worth a thousand words. In this case study, if you wait for pullback, you will have a handson gain; you can enjoy a big move in short time. Waw!
Professional Try Not to Buy and Sell Higher!
Professional trade on retracement.
What if you thought you miss and you jump in. You may be ended up you can not sleep for a days. … As you might be buy high and expecting to sell higher.
Moses
AmiBrokerAcademy.com
Disclaimer
The above result is for illustration purpose. It is not meant to be used for buy or sell decision. We do not recommend any particular stocks. If particular stocks of such are mentioned, they are meant as demonstration of Amibroker as a powerful charting software and MACD. Amibroker can program to scan the stocks for buy and sell signals.
These are script generated signals. Not all scan results are shown here. The MACD signal should use with price action. Users must understand what MACD and price action are all about before using them. If necessary you should attend a course to learn more on Technical Analysis (TA) and Moving Average Convergence Divergence, MACD.
Once again, the website does not guarantee any results or investment return based on the information and instruction you have read here. It should be used as learning aids only and if you decide to trade real money, all trading decision should be your own.